


Forget surveys, have you ever rated an Uber driver or checked the ratings before purchasing something online?
Chances are, yes!
Most of us were familiar with the concept of “rating” long before we knew about survey tools.
Rating questions gained popularity largely because of how simply yet accurately they can quantify data, measure customer satisfaction, gauge preferences, and understand consumer perceptions.
More than just a series of checkboxes or stars, they are powerful tools for capturing the complexities of human opinions and experiences in a structured, easy-to-analyze way.
In this blog, I will explain everything from the basics of rating scales to their strategic application and their pros and cons.
Let’s get started!
Watch: How to Create a Survey Using ProProfs Survey Maker
What Is a Rating Scale?
A rating scale is a key tool used in research to measure people’s attitudes, opinions, and behaviors. It consists of questions where respondents rate something on a scale, like 1 to 5 or “strongly agree” to “strongly disagree.”
This method is vital for surveys, assessments, and evaluations, as it helps collect opinions in a way that can be easily analyzed and compared.
The goal is to capture the intensity of the respondent’s feelings or the degree of their agreement with a statement.
Types of Rating Scale
Rating scales come in multiple forms to accommodate various survey requirements. Understanding the different types of rating scales can help you choose the best one for your needs. Here’s a breakdown of the various types:
1. Slider Rating Scale
A slider rating scale allows respondents to slide a marker along a continuous line to select their response. This type of scale is interactive and offers more precision since respondents can choose any point along the scale.
2. Frequency Scale
Frequency scales measure how often an event occurs. They are typically used to gauge the regularity of behaviors or occurrences.
3. Comparative Rating Scale
Comparative rating scales ask respondents to compare two or more items directly. This helps to understand preferences or perceived differences between items.
4. Ordinal Scale
Ordinal scales rank items in order of preference or importance but do not measure the exact difference between them. They help to establish a hierarchy.
5. Interval Scale
Interval scales not only rank items but also measure the precise differences between them. This scale has equal intervals between points, allowing for detailed statistical analysis.
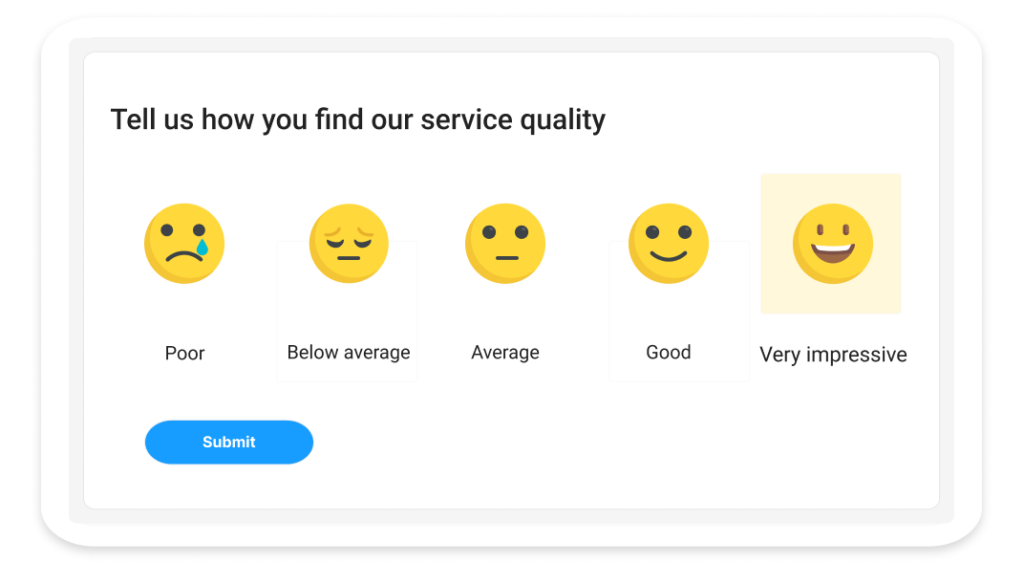
6. Graphic Rating Scale
Graphic rating scales use pictures or graphics to represent the scale points. They are particularly useful for surveys involving children or when you want to make the survey more engaging.
7. Descriptive Rating Scale
Descriptive rating scales provide specific descriptions for each point on the scale, making it easier for respondents to choose an answer that best matches their feelings.
8. Numerical Rating Scale
Numerical rating scales use numbers to represent the scale points. These are straightforward and easy to use, making them a popular choice for NPS surveys.
Examples of Rating Scale Questions
Rating scales come in formats to achieve your unique research goals. Let’s look at some prime examples of rating scales for questionnaires.
A. Customer Satisfaction (CSAT) Surveys:
Customer satisfaction surveys measure how happy customers are with products, services, or experiences.
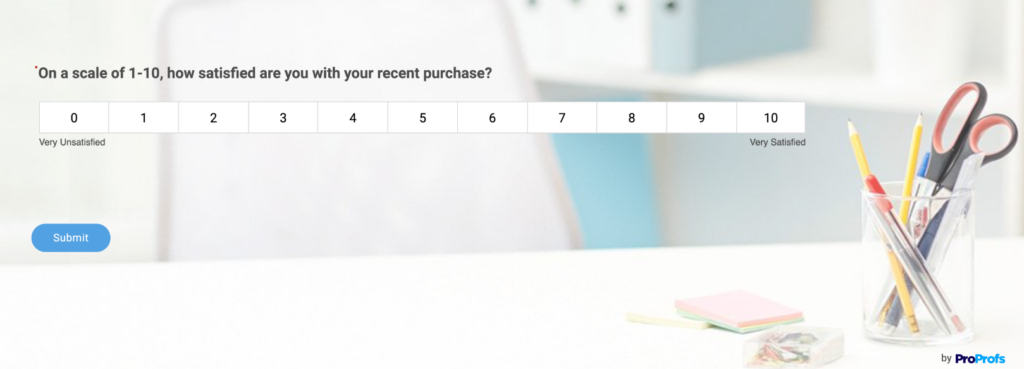
- On a scale of 1-10, how satisfied are you with your recent purchase?
- Example 10-point scale: Very unsatisfied – 1 2 3 4 5 6 7 8 9 10 – Very satisfied
- Please rate your agreement with the following statement: “[Company] made it easy for me to resolve my issue.”
- Example 5-point scale: Strongly disagree | Disagree | Neither agree nor disagree | Agree | Strongly agree
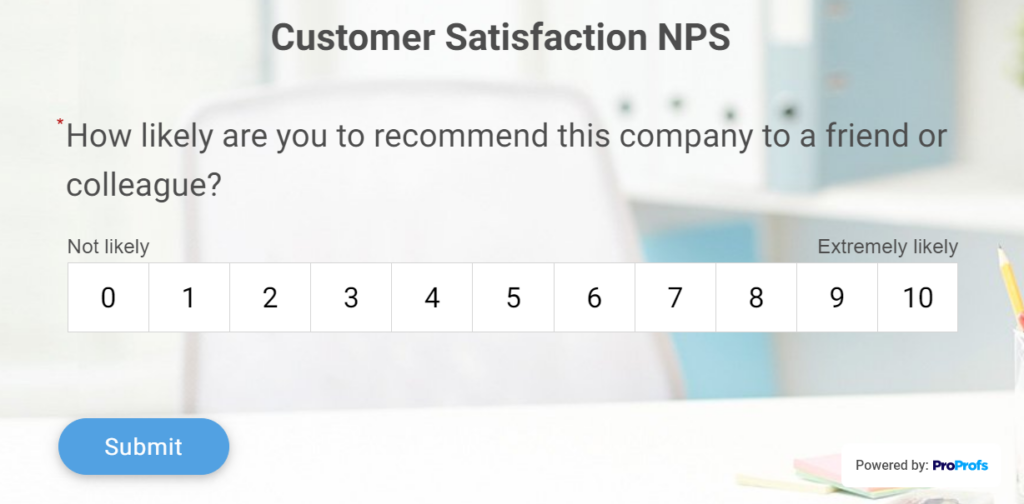
- How likely are you to recommend our product to a friend or colleague?
- Example 10-point scale: Not at all likely – 1 2 3 4 5 6 7 8 9 10 – Extremely likely
- How would you rate the quality of our customer service?
- Example 5-point scale: Very poor | Poor | Average | Good | Excellent
- How often do you purchase from our store?
- Example 4-point scale: Daily, Weekly, Monthly, Rarely
- How satisfied are you with the delivery time of your order?
- Example 5-point scale: Very unsatisfied | Unsatisfied | Neutral | Satisfied | Very satisfied
- Please rate your overall experience with our website.
- Example 5-point scale: Very poor | Poor | Average | Good | Excellent
- How satisfied are you with the variety of products available?
- Example 5-point scale: Very unsatisfied | Unsatisfied | Neutral | Satisfied | Very satisfied
- Please rate your satisfaction with the value for money of our products.
- Example 5-point scale: Very dissatisfied | Dissatisfied | Neutral | Satisfied | Very satisfied
- How would you rate the packaging of your order?
- Example 5-point scale: Very poor | Poor | Average | Good | Excellent
B. Employee Engagement Surveys:
Employee engagement surveys assess how engaged and satisfied employees are with their workplace.
- How likely are you to recommend our company as a great place to work?
- Example 10-point scale: Not at all likely – 1 2 3 4 5 6 7 8 9 10 – Extremely likely
- Please rate your agreement with the following statement: “I feel valued for the work I do.”
- Example 5-point scale: Strongly disagree | Disagree | Neutral | Agree | Strongly agree
- How often do you feel motivated to do your best at work?
- Example 4-point scale: Never, Sometimes, Often, Always
- How satisfied are you with your current job role?
- Example 5-point scale: Very dissatisfied | Dissatisfied | Neutral | Satisfied | Very satisfied
- Please rate your agreement with the following statement: “I have the resources I need to do my job well.”
- Example 5-point scale: Strongly disagree | Disagree | Neutral | Agree | Strongly agree
- How would you rate the communication within your team?
- Example 5-point scale: Very poor | Poor | Average | Good | Excellent
- How often do you receive recognition for your work?
- Example 4-point scale: Never, Rarely, Sometimes, Often
- How satisfied are you with the opportunities for career growth in our company?
- Example 5-point scale: Very dissatisfied | Dissatisfied | Neutral | Satisfied | Very satisfied
- Please rate your agreement with the following statement: “I understand the company’s vision and goals.”
- Example 5-point scale: Strongly disagree | Disagree | Neutral | Agree | Strongly agree
- How would you rate the overall work environment?
- Example 5-point scale: Very poor | Poor | Average | Good | Excellent
C. Product Development:
Product development surveys gather feedback on new or existing products to understand user preferences and areas for improvement.

- How would you rate the ease of use of our new software feature?
- Example 5-point scale: Very difficult | Difficult | Neutral | Easy | Very easy
- How important are the following features to you?
- Example 5-point scale for each feature: Not important | Slightly important | Moderately important | Very important | Extremely important
- On a scale of 1-7, how likely are you to use this feature regularly?
- Example 7-point scale: Not at all likely – 1 2 3 4 5 6 7 – Very likely
- How would you rate the overall design of our product?
- Example 5-point scale: Very poor | Poor | Average | Good | Excellent
- Please rate your agreement with the following statement: “The product meets my needs.”
- Example 5-point scale: Strongly disagree | Disagree | Neutral | Agree | Strongly agree
- How satisfied are you with the performance of our product?
- Example 5-point scale: Very dissatisfied | Dissatisfied | Neutral | Satisfied | Very satisfied
- How likely are you to recommend this product to others?
- Example 10-point scale: Not at all likely – 1 2 3 4 5 6 7 8 9 10 – Extremely likely
- How often do you use our product?
- Example 4-point scale: Daily, Weekly, Monthly, Rarely
- How would you rate the value for money of this product?
- Example 5-point scale: Very poor | Poor | Average | Good | Excellent
- Please rate your satisfaction with the customer support for this product.
- Example 5-point scale: Very dissatisfied | Dissatisfied | Neutral | Satisfied | Very satisfied
D. Educational Assessments:
Educational assessments use rating scales to evaluate students’ understanding, satisfaction, and educational experiences.

- How would you rate your overall satisfaction with this course?
- Example 5-point scale: Very dissatisfied | Dissatisfied | Neutral | Satisfied | Very satisfied
- Please rate your agreement with the following statement: “The course materials were helpful in understanding the subject.”
- Example 5-point scale: Strongly disagree | Disagree | Neutral | Agree | Strongly agree
- How frequently did you attend the class sessions?
- Example 4-point scale: Never, Sometimes, Often, Always
- How would you rate the quality of instruction in this course?
- Example 5-point scale: Very poor | Poor | Average | Good | Excellent
- Please rate your agreement with the following statement: “I feel prepared for the exams in this course.”
- Example 5-point scale: Strongly disagree | Disagree | Neutral | Agree | Strongly agree
- How satisfied are you with the feedback you receive on your assignments?
- Example 5-point scale: Very dissatisfied | Dissatisfied | Neutral | Satisfied | Very satisfied
- How often do you participate in class discussions?
- Example 4-point scale: Never, Rarely, Sometimes, Often
- How would you rate the availability of your instructor outside of class?
- Example 5-point scale: Very poor | Poor | Average | Good | Excellent
- Please rate your agreement with the following statement: “The course workload is manageable.”
- Example 5-point scale: Strongly disagree | Disagree | Neutral | Agree | Strongly agree
- How would you rate the overall learning environment of this course?
- Example 5-point scale: Very poor | Poor | Average | Good | Excellent
| Want to get started quickly? Try our |
E. Healthcare Surveys:
Healthcare surveys evaluate patient experiences and the quality of care received.
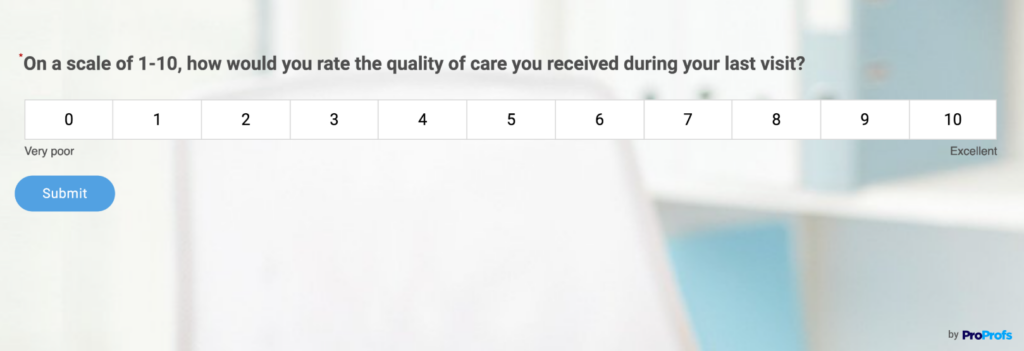
- On a scale of 1-10, how would you rate the quality of care you received during your last visit?
- Example 10-point scale: Very poor – 1 2 3 4 5 6 7 8 9 10 – Excellent
- Please rate your agreement with the following statement: “The medical staff was attentive to my needs.”
- Example 5-point scale: Strongly disagree | Disagree | Neutral | Agree | Strongly agree
- How often do you follow the health advice given by your healthcare provider?
- Example 4-point scale: Never, Sometimes, Often, Always
- How satisfied are you with the cleanliness of our facility?
- Example 5-point scale: Very dissatisfied | Dissatisfied | Neutral | Satisfied | Very satisfied
- Please rate your agreement with the following statement: “I was able to get an appointment easily.”
- Example 5-point scale: Strongly disagree | Disagree | Neutral | Agree | Strongly agree
- How would you rate the professionalism of the medical staff?
- Example 5-point scale: Very poor | Poor | Average | Good | Excellent
- How satisfied are you with the explanation of your treatment options?
- Example 5-point scale: Very dissatisfied | Dissatisfied | Neutral | Satisfied | Very satisfied
- How often do you feel your health concerns are taken seriously?
- Example 4-point scale: Never, Sometimes, Often, Always
- How would you rate the waiting time at our facility?
- Example 5-point scale: Very long | Long | Average | Short | Very short
- Please rate your overall satisfaction with our healthcare services.
- Example 5-point scale: Very dissatisfied | Dissatisfied | Neutral | Satisfied | Very satisfied
F. Market Research:
Market research surveys help understand consumer preferences, behaviors, and perceptions.

- How satisfied are you with the variety of products available in our store?
- Example 5-point scale: Very dissatisfied | Dissatisfied | Neutral | Satisfied | Very satisfied
- Please rate your agreement with the following statement: “I am likely to purchase from this brand again.”
- Example 5-point scale: Strongly disagree | Disagree | Neutral | Agree | Strongly agree
- How often do you use our product in your daily life?
- Example 4-point scale: Rarely, Sometimes, Often, Always
- How would you rate the overall quality of our product?
- Example 5-point scale: Very poor | Poor | Average | Good | Excellent
- Please rate your agreement with the following statement: “This product offers good value for money.”
- Example 5-point scale: Strongly disagree | Disagree | Neutral | Agree | Strongly agree
- How likely are you to recommend our product to others?
- Example 10-point scale: Not at all likely – 1 2 3 4 5 6 7 8 9 10 – Extremely likely
- How satisfied are you with our customer service?
- Example 5-point scale: Very dissatisfied | Dissatisfied | Neutral | Satisfied | Very satisfied
- How often do you encounter issues with our product?
- Example 4-point scale: Never, Rarely, Sometimes, Often
- How would you rate the packaging of our product?
- Example 5-point scale: Very poor | Poor | Average | Good | Excellent
- Please rate your overall satisfaction with our brand.
- Example 5-point scale: Very dissatisfied | Dissatisfied | Neutral | Satisfied | Very satisfied
Advantages and Disadvantages of a Rating Scale
Although widely used in surveys and research to gather insights into attitudes, opinions, and behaviors, like any tool, rating scales come with their own set of advantages and disadvantages.
Here’s a detailed look at both sides:
Advantages
1. Simplicity and Ease of Use
Rating scales are straightforward and easy to understand, making it simple for respondents to provide feedback without extensive instructions. They are also easy to design and implement in surveys, facilitating quick data collection.
2. Quantifiable Data
Rating scales convert subjective responses into quantifiable data, enabling statistical analysis and comparison. This makes it easier to identify trends, patterns, and insights.
3. Versatility
Rating scales can be used in various contexts, such as customer satisfaction surveys, employee engagement assessments, product evaluations, and educational feedback.
4. Depth of Insight
They allow for capturing nuanced opinions and degrees of sentiment, providing a richer understanding of respondents’ views compared to simple yes/no questions.
5. Efficient Data Collection
Rating scales enable the collection of large amounts of data quickly, as respondents can complete them faster than open-ended questions.
5. Standardization
They provide a standardized way of measuring opinions, ensuring consistency across different respondents and surveys.
Disadvantages
6. Limited Depth of Responses
Rating scales often fail to capture the underlying reasons behind a respondent’s rating, providing less qualitative insight compared to open-ended questions.
7. Central Tendency Bias
Respondents may avoid extreme ratings, leading to central tendency bias, where most responses cluster around the middle of the scale.
8. Interpretation Variability
Different respondents may interpret the same scale differently. For example, what one person considers a “4” might be a “3” to another, affecting the reliability of the data.
9. Lack of Context
Rating scales provide limited context for the ratings given, making it difficult to understand the nuances behind each response.
10. Cultural Differences
Cultural factors can influence how respondents use rating scales, leading to inconsistencies in data across different demographic groups.
11. Scale Design Challenges
Designing an effective rating scale requires careful consideration of the number of points, the labels used, and the balance of positive and negative options. Poorly designed scales can lead to misleading or inaccurate data.
12. Respondent Fatigue
In long surveys, respondents may become fatigued and start giving less thoughtful responses, especially if the survey contains numerous rating scale questions.
FREE. All Features. FOREVER!
Try our Forever FREE account with all premium features!
Why Should You Use a Rating Scale?
Rating scales can help you quantify abstract concepts and allow you to assign a rating to every response option.
Here are the top reasons why using rating scales in your surveys can make them more intuitive and flexible and garner higher completion rates.
- Simplicity: They are easy for respondents to understand and complete, which helps gather more responses and reduces survey fatigue.
- Quantifiability: The responses can be easily quantified, allowing for straightforward statistical analysis and comparison.
- Depth of Insight: Despite their simplicity, rating scales can provide deep insights into the intensity and nuances of respondents’ attitudes and perceptions.
- Versatility: They can be applied in various fields, from market research and customer satisfaction surveys to psychological assessments and academic research.
| Want to create a rating-scale survey now? |
How to Write a Perfect Rating Scale Question
A poorly created rating scale question can potentially confuse your audience, hamper your analysis, and increase costs. Here are three steps to create the best rating scale questions for any audience:
Step 1: Choose the Right Rating Scale
As we discussed above, there are different types of rating scales available. Depending on your research goals, you can choose a rating scale that best fits your needs. For instance, if your goal is to identify loyal or at-risk customers, you can go for the traditional NPS rating scale.
Similarly, if you wish to create a survey for your international audience, you can use graphic or pictorial scales.
Step 2: Choose the Right Response Options
Choosing the right response options is as important as the question itself. The scale should offer enough answer options for the respondents to choose the most valid answer. Depending on your objectives, you can go for a 1-5 or 1-7 rating scale.
Make sure the listed options are clear, easy to understand, and free from any technical jargon.
Pro Tip: You can include a text box question after your rating scale question so that respondents can expand on their previous answers. This will help you better understand why someone gave you the rating they did.
Step 3: Share on the Best Channels
Once you are happy with the look and feel of your rating scale questionnaire, you must share it with your target audience. With ProProfs Survey Maker, you can share your survey as a link via email, social media or embed it directly on your website. Moreover, you can even monitor your responses in real time.
Collect In-Depth Insights with Rating Scale Questions In Your Surveys
Rating scales are essential tools for gathering feedback and insights in surveys and research. They simplify the process of measuring attitudes, opinions, and behaviors, making data collection easy and efficient.
By understanding the different types of rating scales and their advantages and disadvantages, you can choose the best approach for your needs. Whether you’re measuring customer satisfaction, employee engagement, or product features, rating scales provide a clear and consistent method.
Creating effective rating scale questions involves clear wording, balanced options, and thorough testing. This ensures you collect reliable and actionable data.
If you are looking to create a rating survey for your brand, but unsure where to start, feel free to try our AI survey generator, or schedule a demo!
FREE. All Features. FOREVER!
Try our Forever FREE account with all premium features!
 We'd love your feedback!
What did you like & how can we make it even better?

 Thanks for your feedback!
 Ask Your Question
Have a question? Get expert help to make your decision easier.