Most companies run employee retention surveys the same way: send a link once a year, skim the averages, present a deck to leadership, and repeat. Then, wonder why people keep leaving.
The problem is not the survey. It is the system around it. When a retention survey is designed well, deployed at the right moment, and followed by visible action, it becomes one of the most cost-effective HR tools you have.
The Work Institute’s 2025 Retention Report analyzed over 120,000 exit interviews and found that 75% of voluntary departures were preventable.
That means three out of four resignations did not have to happen. The data to catch them was available. It just was not being collected or acted on.
This guide walks you through how to build and run an employee retention survey that actually works, from what to ask and when to ask it, to how to act on what you find.
ProProfs Survey Maker’s AI Survey Maker can generate a full, ready-to-send retention survey from a single plain-language goal in seconds.
What Is an Employee Retention Survey?
An employee retention survey, also called an employee retention questionnaire, is a structured feedback tool that measures the factors driving an employee’s intent to stay or leave. Unlike exit interviews, which collect data after the decision is already made, retention surveys catch the signal while the employee is still there.
The distinction from an engagement survey matters. Engagement surveys measure motivation, emotional investment, and day-to-day satisfaction.
They are useful for culture monitoring. Retention surveys are more targeted: they ask whether someone plans to stay and, if not, why.
The two overlap, but a retention survey is built for forecasting and early intervention, not just sentiment measurement.
What makes them worth running?
According to the SHRM 2025 report, the cost of replacing an employee can range from 50% to 200% of their annual salary.
A mid-level employee earning $70,000 costs between $35,000 and $140,000 to replace when you account for recruiting, onboarding, and the productivity gap while the role ramps up.
At a 50-person company losing three people a year, that is a retention problem quietly costing $150,000 to $600,000 annually, most of it preventable.
A well-run employee retention survey turns that cost exposure into a list of specific, fixable problems. Here is how to build one.
How to Create an Employee Retention Survey Using ProProfs Survey Maker
Most HR teams stall on survey creation because the blank-page problem is real. Here is how to go from zero to a deployed, anonymized, logic-enabled survey in under 20 minutes.
Step 1: Set Your Goal
Before you open any tool, decide what this survey is measuring. Is it an annual full survey covering all five retention categories?
A 60-day new hire pulse on onboarding and role clarity? A targeted check-in after a leadership change?
The goal determines the question set, the length, and who receives it. A survey trying to measure everything measures nothing well.
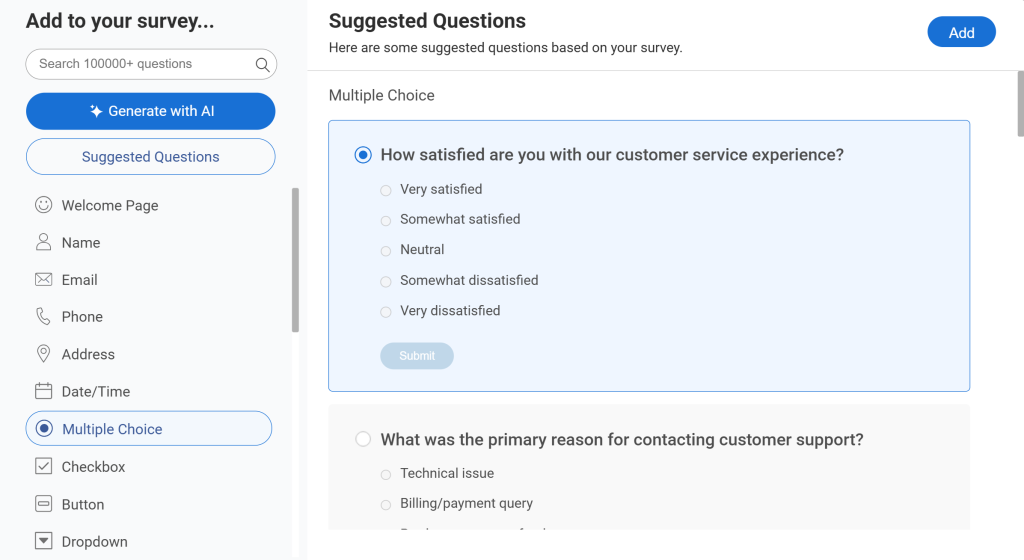
Step 2: Start From a Template or Use AI
Log in to ProProfs Survey Maker and go to Create Survey. Choose from 100+ HR and employee engagement templates, or describe your goal in plain language, and the AI Survey Maker generates a complete survey with questions, scales, and branching logic in seconds.
Here’s how you can use AI. Enter the prompt [Build a 10-question pulse survey for new hires at the 60-day mark. Focus on onboarding clarity, role alignment, and early manager relationships. Keep it under 5 minutes to complete in the widget below and try it yourself:
Describe your survey and we'll create it for you
If you have an existing HR questionnaire or past retention survey in PDF or Word format, you can upload it directly, and ProProfs will use AI to convert it into a structured, editable survey.
Step 3: Select Your Question Mix
Use a combination of Likert scales (Strongly Disagree to Strongly Agree) for tracking trends over time, 1-to-10 rating scales for flight risk and overall satisfaction, Yes/No questions for behavioral checkpoints, and one or two open-ended questions for depth.
Keep open-ended questions to a maximum of two per survey.
On small teams, more than two open-ended questions increase the risk that employees can be identified by their writing style, which suppresses honesty.
Step 4: Add Skip Logic
Use skip logic to make the survey feel responsive rather than generic.
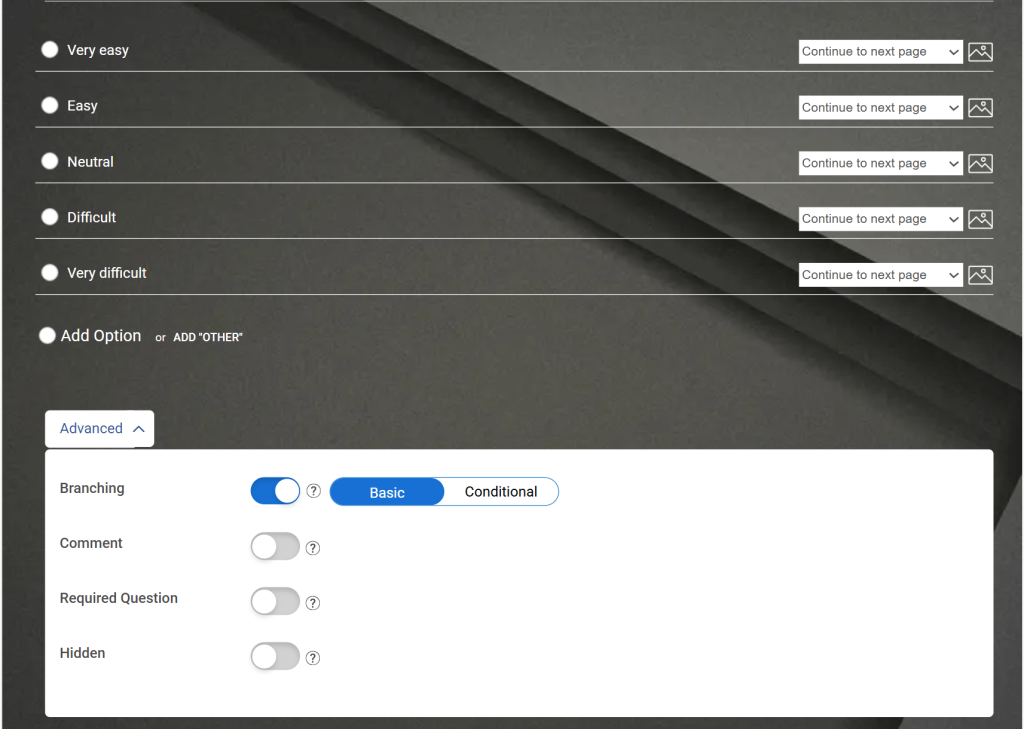
A “No” on the question about career development conversations in the past 90 days should route the employee to a follow-up asking what kind of support would be most useful.
A low rating on manager support should branch to an open-ended question about what a better experience would look like.
This takes two minutes to configure and significantly improves the quality of open-ended responses.
Step 5: Configure Anonymity Properly
Under Settings, disable individual response tracking and set the survey to allow only one response per device or session. This is not optional.
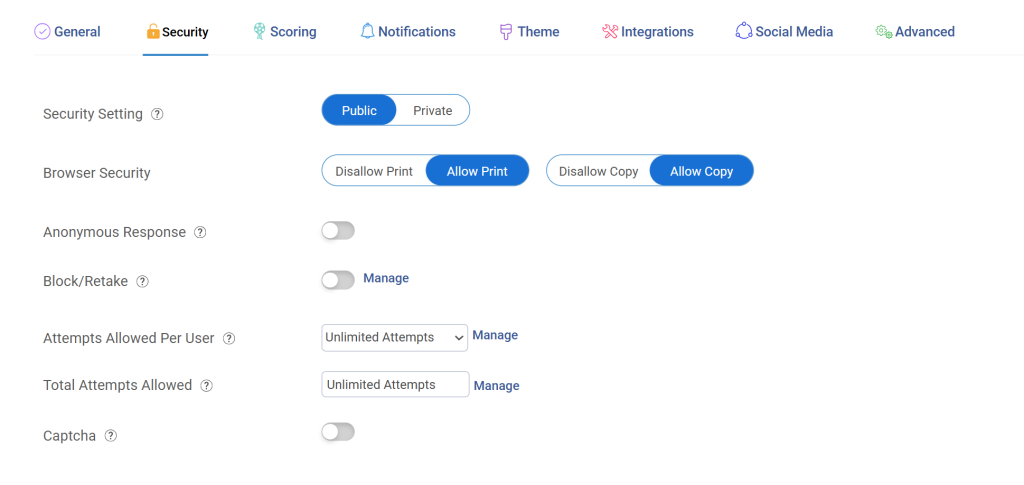
Communicate the anonymity configuration to employees in the launch email, specifically: what data is and is not collected, how responses are aggregated, and who can see the results.
The mechanics of anonymity matter less than whether employees believe them.
Step 6: Distribute and Set a Deadline
Use ProProfs’ email distribution to send directly from the platform, or copy the survey link for Slack, your HRIS, or QR code for in-person teams.
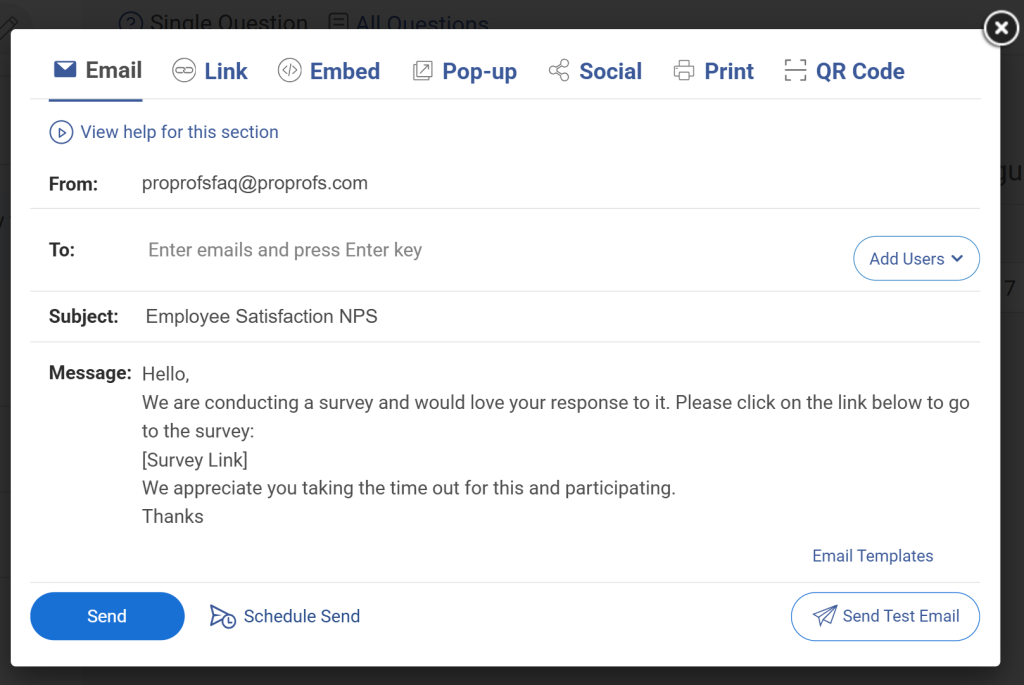
Set a two-week response window. Schedule two automated reminders: one at day 5 and one at day 11.
Do not send more than two reminders. Over-reminding signals pressure, which reduces trust and suppresses honest responses.
40 Employee Retention Survey Questions by Category
These questions cover the five categories that drive voluntary exits: engagement and purpose, career growth, compensation and benefits, manager quality, and company culture.
Use the full set for an annual survey.
For tenure pulses or event-triggered check-ins, select 8 to 10 questions from the categories most relevant to that audience.
The Single Best Retention Predictor
One question outperforms every other in predicting actual turnover behavior: “Do you see yourself working here two years from now?” (question 6 below). Include it in every survey, every cycle. It is your early warning flag.
Category 1: Engagement and Purpose
These questions measure whether employees feel connected to their work and the organization. Disengagement is the earliest-stage signal of retention risk.
Gallup’s 2026 State of the Global Workplace 2025 report found that global employee engagement fell to 20%, with each percentage point decline representing roughly 21 million fewer engaged workers worldwide.
| No. | Question | What It Gauges | Format |
| 1 | My work gives me a clear sense of purpose. | Intrinsic motivation and meaning | Likert Scale |
| 2 | I feel proud to work at this company. | Organizational identification | Likert Scale |
| 3 | I feel motivated to go above what my role strictly requires. | Discretionary effort and commitment | Likert Scale |
| 4 | I have the resources and support I need to do my job well. | Enablement and operational friction | Likert Scale |
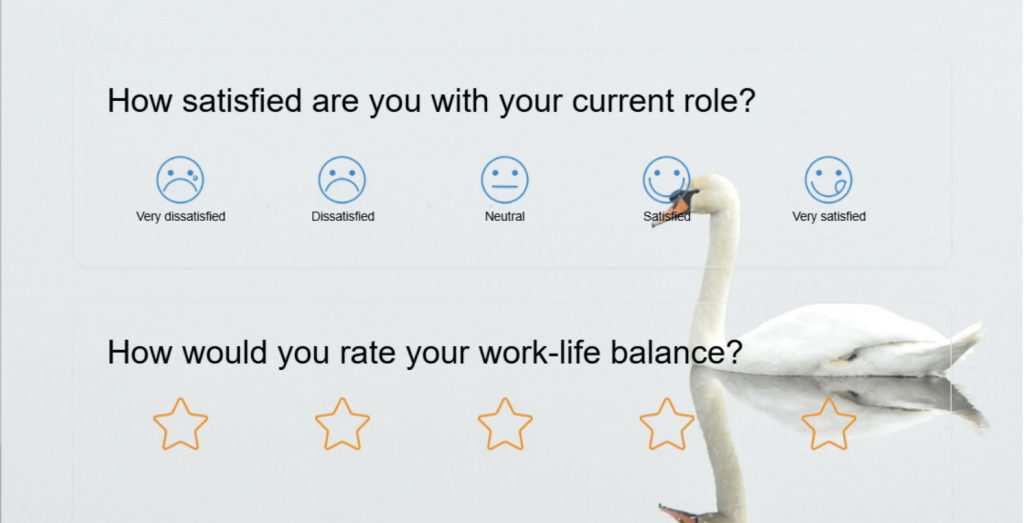
| 5 | On a scale of 1 to 10, how satisfied are you with your current role and responsibilities? | Overall role satisfaction baseline | 1-to-10 Scale |
| 6 | On a scale of 1 to 10, how likely are you to still be working here in two years? | Flight risk and retention intent | 1-to-10 Scale |
| 7 | Do you feel your contributions are valued by this organization? | Recognition and psychological safety | Yes/No |
| 8 | What is one thing that would make you more excited to come to work each day? | Open signal for unasked issues | Open-Ended |
Here’s an employee engagement template you can use for retention:
Category 2: Career Growth and Development
Career stagnation is the number one driver of voluntary exits, per the Work Institute 2025 Retention Report and SHRM 2025 research.
These questions measure whether employees can see a future here.
| No. | Question | What It Gauges | Format |
| 9 | I have a clear understanding of my career path at this company. | Career visibility and trajectory clarity | Likert Scale |
| 10 | My manager actively supports my professional development goals. | Manager’s investment in growth | Likert Scale |
| 11 | I have access to [training or learning opportunities] that help me grow. | Learning resource availability | Likert Scale |
| 12 | I feel challenged in my current role in a productive way. | Stretch and engagement without burnout | Likert Scale |
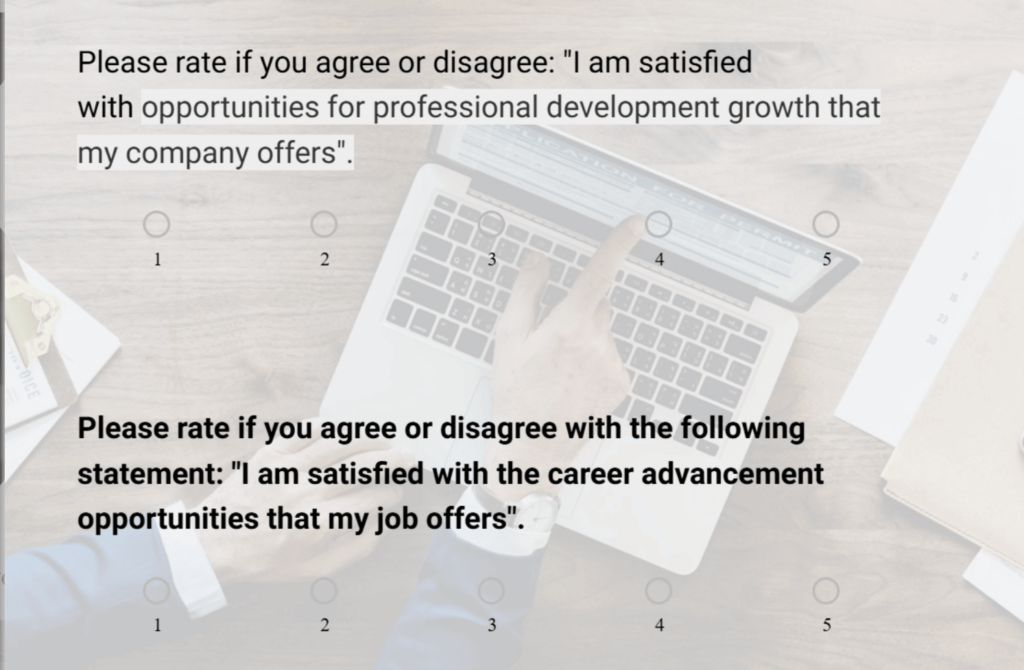
| 13 | On a scale of 1 to 10, how satisfied are you with the growth opportunities available to you? | Growth satisfaction benchmark | 1-to-10 Scale |
| 14 | Have you had a career development conversation with your manager in the past 90 days? | Manager follows through on development | Yes/No |
| 15 | Do you feel the company provides a realistic path for advancement? | Perceived upward mobility | Yes/No |
| 16 | What skill or experience would you most like to develop in the next 12 months, and how can we support that? | Specific unmet development needs | Open-Ended |
Here’s a career development survey template you can use to increase retention:
Category 3: Compensation and Benefits
Pay is not the top reason people leave, but perceived unfairness is. These questions measure perceived fairness, not just satisfaction levels.
| No. | Question | What It Gauges | Format |
| 17 | I believe my compensation is fair relative to my contributions. | Internal pay equity perception | Likert Scale |
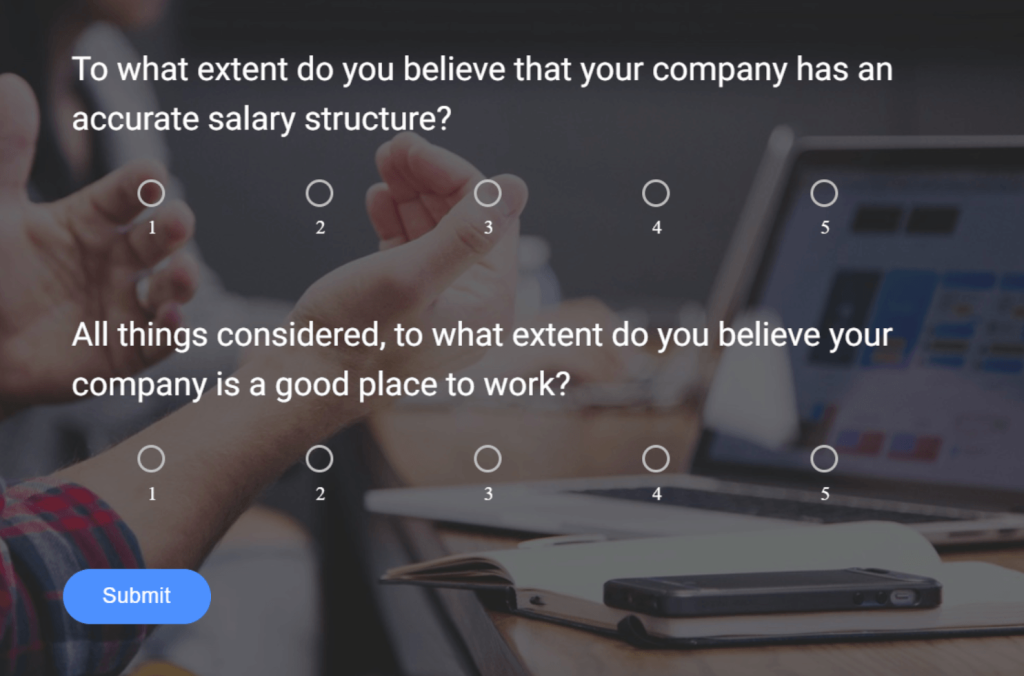
| 18 | I feel my pay reflects what similar roles earn in the broader market. | External market alignment perception | Likert Scale |
| 19 | The benefits package (health, retirement, time off) meets my needs. | Benefits adequacy | Likert Scale |
| 20 | On a scale of 1 to 10, how satisfied are you with your total compensation? | Compensation satisfaction baseline | 1-to-10 Scale |
| 21 | On a scale of 1 to 10, how well does the company support your work-life balance? | Work-life sustainability | 1-to-10 Scale |
| 22 | Are there benefits or perks not currently offered that would meaningfully improve your experience here? | Benefits gaps and unmet expectations | Yes/No |
| 23 | What changes to compensation or benefits would have the greatest impact on your decision to stay? | Highest-leverage retention lever for this employee | Open-Ended |
Here’s an employee benefits survey template you can use:
Category 4: Manager and Leadership Quality
This is the most under-measured category in most retention surveys, and the most consequential.
Gallup’s 2026 research shows that 70% of team engagement variance is driven by the manager, yet manager engagement globally fell from 31% to 22% between 2022 and 2025.
When analyzing results, segment this category at the team level to protect anonymity.
| No. | Question | What It Gauges | Format |
| 24 | My manager communicates clear expectations for my role and performance. | Role clarity and direction quality | Likert Scale |
| 25 | My manager gives me regular, useful feedback on my work. | Feedback frequency and quality | Likert Scale |
| 26 | I feel comfortable raising concerns or new ideas with my manager. | Psychological safety with the manager | Likert Scale |
| 27 | My manager advocates for me and my team’s needs. | Manager as sponsor and protector | Likert Scale |
| 28 | My manager treats all team members fairly and consistently. | Perceived fairness and consistency | Likert Scale |
| 29 | On a scale of 1 to 10, how supported do you feel by your direct manager? | Overall manager support benchmark | 1-to-10 Scale |
| 30 | Does your manager help you understand how your work connects to the company’s broader goals? | Strategic alignment and purpose-linking | Yes/No |
| 31 | Has your manager recently recognized a meaningful contribution you made? | Recognition behavior of the manager | Yes/No |
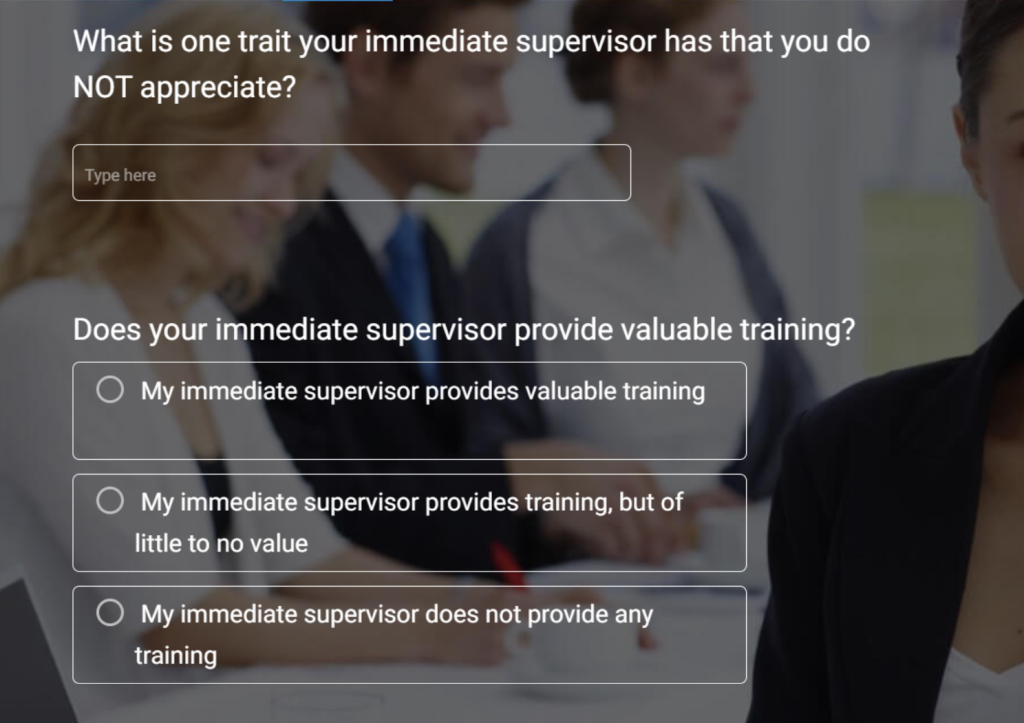
| 32 | What is one thing your manager or leadership team could do differently to improve your experience? | Specific behavioral change signal | Open-Ended |
Here’s a managerial feedback survey template you can use:
Category 5: Company Culture and Belonging
Culture is the context in which everything else happens. The iHire 2024 Talent Retention Report found that 32.4% of employees who quit cited workplace culture as their top concern, making it the single most-cited exit reason across industries.
These questions measure psychological safety, inclusion, and the gap between stated and lived values.
| No. | Question | What It Gauges | Format |
| 33 | I feel I can be myself at work without negative consequences. | Psychological safety and authenticity | Likert Scale |
| 34 | The company’s stated values are reflected in how decisions are actually made. | Values authenticity vs. stated values gap | Likert Scale |
| 35 | I feel a genuine sense of belonging on my team. | Inclusion and team cohesion | Likert Scale |
| 36 | Communication from leadership is transparent and consistent. | Leadership communication trust | Likert Scale |
| 37 | On a scale of 1 to 10, how would you rate the overall company culture? | Culture sentiment baseline | 1-to-10 Scale |
| 38 | On a scale of 1 to 10, how well does this company support your well-being? | Well-being and sustainability perception | 1-to-10 Scale |
| 39 | Would you recommend this company as a great place to work to a friend in your field? | Net Promoter-style employer brand signal | Yes/No |
| 40 | Is there anything about our culture or environment that you feel is not discussed openly enough? | Hidden friction and undiscussed issues | Open-Ended |
Here’s a template to gauge company culture and belongingness:
How to Design, Time, and Run Your Survey Program
Questions are only one part of a retention survey system. The decisions around design, timing, and cadence are what determine whether the data you collect is honest, representative, and actionable.
Design for Honesty First
The most common failure mode in retention surveys is not bad questions. It is employees who do not believe their responses are truly anonymous.
Forum discussions in HR communities suggest this number may be higher in organizations where previous surveys were followed by no visible action or, worse, by perceived retaliation.
Real anonymity requires three things: a tool that does not track individual responses, a clear communication to employees about exactly what data is and is not collected, and a track record of acting on survey results without identifying individuals.
Here’s how you can build your anonymous employee retention surveys:
The third one takes time to build, but the first two can be in place before your first survey launches.
Keep the annual full survey to 15 to 20 questions. Longer surveys produce fatigue bias: response quality on questions 18 through 25 of a 30-question survey is meaningfully worse than on a focused 15-question version.
Mix Likert scales for trend tracking, 1-to-10 scales for high-signal items like flight risk and manager support, and limit open-ended questions to one or two per survey.
Use consistent scales across cycles. Switching from a 5-point Likert to a 10-point rating scale between years destroys your ability to track trends. Pick your scale architecture once and hold it.
On small teams, be careful with demographic questions.
Asking for role, tenure band, department, and gender simultaneously on a 10-person team effectively removes anonymity through combination.
Either limit demographic questions on small teams or use broader groupings.
Time Surveys to Tenure, Not the Calendar
The biggest structural mistake most companies make is running one annual all-hands survey and treating the results as representative.
Flight risk does not distribute evenly across the employee lifecycle. It concentrates on predictable moments.
| Survey Type | Audience | Timing | Focus |
| New Hire Pulse | All new hires | Day 60 | Onboarding clarity, role alignment, and manager support |
| Early-Tenure Check-In | Employees at 6 months | Month 6 | Engagement, workload, growth visibility |
| Annual Full Survey | All employees | Once per year | All five retention categories |
| Post-Change Pulse | Affected teams | Within 2 weeks of a change | Morale, clarity, and communication quality |
| Pre-Review Cycle Pulse | High-performers | 4 weeks before reviews | Growth expectations, compensation alignment |
New hires are most vulnerable at the 60-to-90-day mark, when the gap between expectation and reality is freshest.
Employees at 12 to 18 months often hit a career growth plateau.
The 3-year mark is when people start asking whether this company is where they want to be long-term. An annual survey catches none of these windows reliably. A tenure-based program does.
Run the annual full survey as your anchor. Layer tenure pulses and event-triggered check-ins around it for a continuous signal instead of a single yearly snapshot.
Close the Loop or Lose the Trust
Survey fatigue is real, but the bigger problem is survey cynicism. HR communities consistently flag this: employees stop participating honestly, not because surveys are too long, but because they have completed multiple cycles and seen nothing change.
The fix is simple and non-negotiable. Within two weeks of closing every survey, share a summary of findings with all participants.
Be specific about what you found.
Name the two or three things you are changing and by when. Name the things you are not changing and explain why. Assign an owner to each action item. Then follow up publicly on the timeline.
This single practice, done consistently, is what converts survey infrastructure into retention infrastructure.
FREE. All Features. FOREVER!
Try our Forever FREE account with all premium features!
How to Analyze and Act on Your Employee Retention Survey Results
Collecting data is the easy part. The value is entirely in what happens next, while analyzing the survey data.
Segment Before You Summarize
Do not start with the company-wide average score. A 7.5 out of 10 overall satisfaction rating masks the fact that your 12-to-18-month cohort might be scoring 5.2.
Start by filtering results by tenure band, then by department, then by role level. The overall number almost always hides where the actual problem is.
Career stagnation, work-life imbalance, and management failures drove 63% of all job exits in 2024, per the Work Institute 2025 Retention Report.
All three are category-specific signals that disappear in blended averages. Segment first.
Build a Flight-Risk Index
Three questions in the survey above are your strongest predictors of actual turnover intent: question 6 (likelihood to be here in two years), question 29 (manager support rating), and question 39 (would recommend as an employer).
Score these questions together for each department or tenure cohort. Any group scoring below a threshold across all three becomes your immediate intervention priority.
This gives you a fast, repeatable way to identify where to spend HR attention before a resignation wave rather than after.
Prioritize by Frequency and Impact
Not every low score requires action. Prioritize issues that are both high-frequency, flagged by more than 30% of respondents in a segment, and high-impact, directly tied to stated reasons for considering leaving.
Career growth clarity and manager communication quality consistently rank highest on both dimensions across industries.
Vague commitments produce no change and erode trust faster than no response at all. For each action item, name the owner, define what done looks like, and set a date.
Career development concerns might go to a manager training initiative owned by HR with a 60-day timeline.
Compensation fairness concerns might trigger a compensation benchmarking review owned by Finance with a 90-day timeline.
Schedule the Next Touchpoint
Do not wait for the next annual cycle. Run quarterly pulses on the top two or three issues flagged in the annual survey.
This closes the signal gap and signals to employees that retention is an ongoing operational priority, not a once-a-year exercise.
Access the ProProfs Survey Maker reporting dashboard to filter results by department, tenure band, or question category in real time.
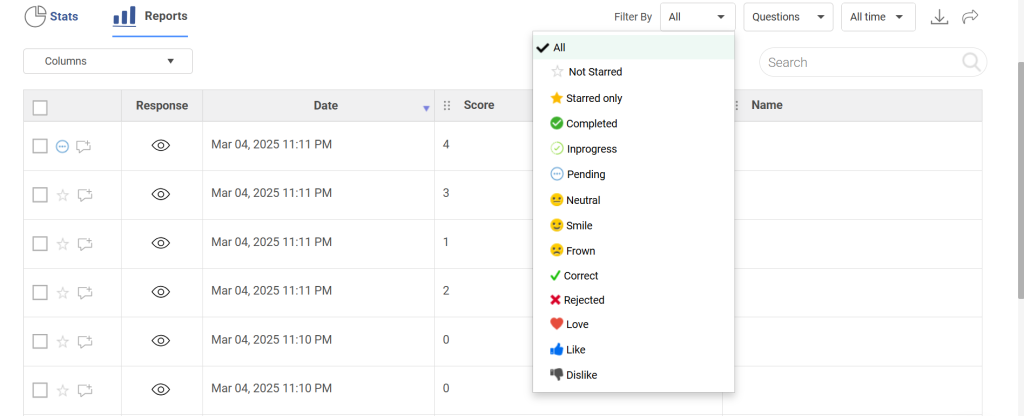
Export to Excel for deeper segmentation or CRM integration.
Share a findings summary with all employees within two weeks of survey close, including the specific actions being taken and by when.
Your Employees Are Telling You Why They Will Leave. An Employee Retention Survey Is How You Listen
You are probably still going to lose some people you did not see coming. That is true for every organization.
But three out of four of those departures did not have to happen, and the signal was there before the resignation letter.
A retention survey does not fix everything.
What it does is give you a structured, repeatable way to catch the signals that are already there, before they become exits you are scrambling to backfill.
Run the survey using ProProfs Survey Maker. Act on what you find. Tell people what you did. That cycle, repeated consistently, is what retention looks like in practice.
Frequently Asked Questions
What is an employee retention survey?
An employee retention survey, also called an employee retention questionnaire, is an anonymous questionnaire that measures job satisfaction, flight risk, and the factors driving an employee's decision to stay or leave. It identifies retention risks before they become resignations, giving HR teams the data to act on the highest-impact issues while the employee is still there.
What is the difference between an employee retention survey and an engagement survey?
Engagement surveys measure motivation, satisfaction, and emotional investment in the work. Retention surveys focus specifically on flight risk and the factors that drive people to stay or leave. Retention surveys are forward-looking and predictive; engagement surveys are better suited to ongoing culture monitoring. Both are useful, but they answer different questions.
When should you run an employee retention survey?
Run a full annual survey as your baseline, then layer in tenure-based pulses at 60 days, 6 months, and 12 to 18 months for new and early-tenure employees. Add event-triggered pulses after major changes like restructuring, leadership transitions, or return-to-office mandates. Flight risk concentrates at predictable tenure milestones, not random calendar dates.
What is the most predictive employee retention survey question?
"Do you see yourself working here two years from now" has the strongest correlation with actual turnover intent. Pair it with the manager support rating (question 29) and the employer recommendation question (question 39) for a compact three-question flight-risk index you can track consistently across every survey cycle and department cohort.
How do you get employees to respond honestly to a retention survey?
Three things drive honest responses: genuine anonymity with explicit communication about how data is aggregated, short surveys that respect the respondent's time, and visible follow-through from previous cycles. If employees believe nothing has changed after the last survey, both participation rates and response honesty will decline sharply in the next one.
How many questions should an employee retention survey have?
15 to 20 questions for an annual full survey. 8 to 10 questions for tenure pulses and event-triggered check-ins. Longer surveys reduce completion rates and introduce fatigue bias in later responses, where respondents click through quickly rather than answer thoughtfully. Fewer, sharper questions consistently produce more reliable and honest data.
What should you do after running an employee retention survey?
Filter results by tenure and department before looking at overall averages. Identify the two or three highest-impact issues using frequency and exit intent as filters. Assign an owner, define what success looks like, and set a deadline. Share findings and specific commitments with all survey participants within two weeks of closing the survey.
How is an employee retention survey different from an employee retention strategy questionnaire?
An employee retention survey collects data from employees about their lived experience. An employee retention strategy questionnaire is typically used internally by HR or leadership to audit the organization's retention practices, policies, and gaps. The survey tells you what employees feel. The strategy questionnaire tells you what systems and programs you have in place to address those feelings.
FREE. All Features. FOREVER!
Try our Forever FREE account with all premium features!
 We'd love your feedback!
What did you like & how can we make it even better?

 Thanks for your feedback!
 Ask Your Question
Have a question? Get expert help to make your decision easier.