Do all your customers love you? Unlikely. Most products have three groups at any given time: a few loyal fans, a few unhappy users, and a large middle that feels indifferent. That middle is where risk hides.
Customers expect a solid product, fast support, and visible follow-through on feedback. Even when you are executing well, some users quietly disengage while others complain loudly. The real question is simple: who will stay, who might leave, and why.
That’s what calculating NPS helps you uncover. Net Promoter Score uses a simple 0–10 question to separate promoters, passives, and detractors, so you can see who is loyal, who is at risk, and where to focus.
This guide shows how to calculate NPS, what the score actually means, and how to use it to improve customer loyalty.
Defining Net Promoter Score (NPS)
Net Promoter Score is a customer loyalty and experience measurement developed by Fred Reichheld (along with Bain & Company and Satmetrix) in 2003. It’s built around one simple question:
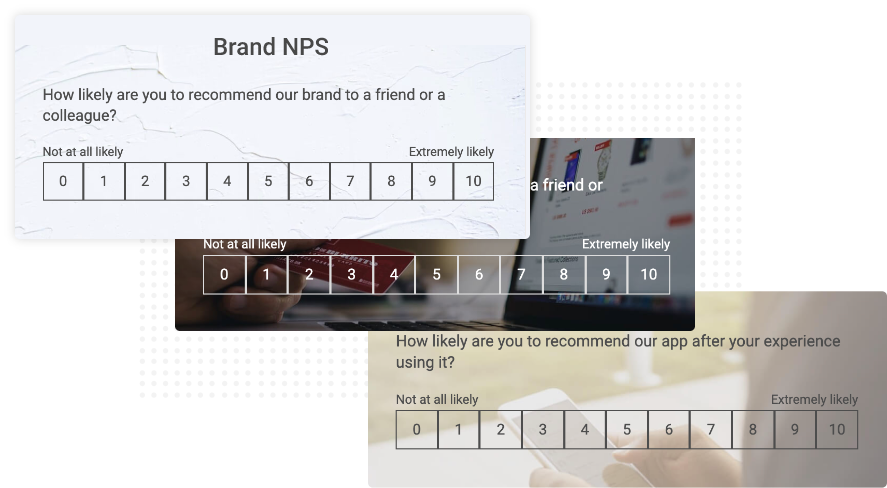
“How likely is it that you would recommend our [organization/product/service] to a friend or family member?”
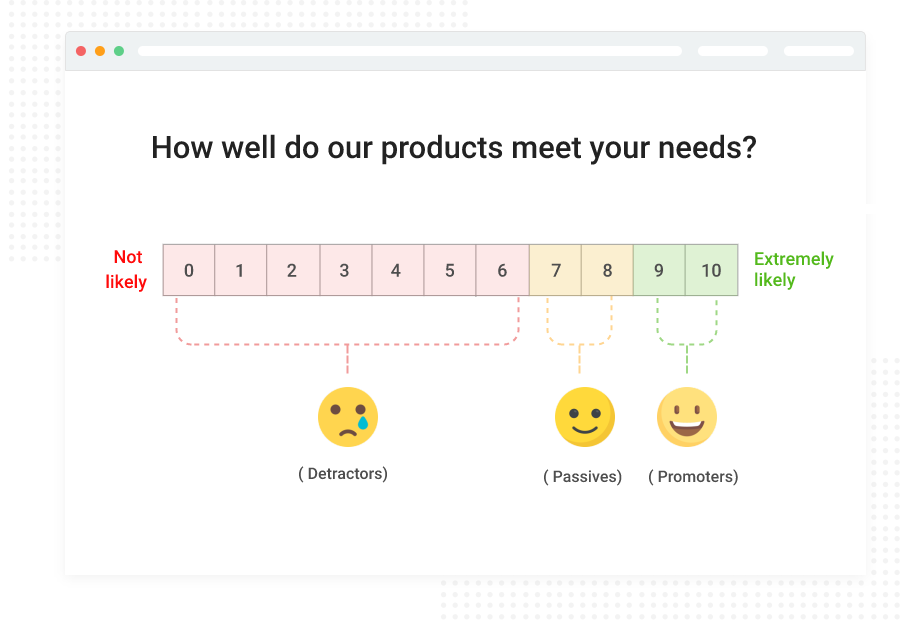
Customers respond on a scale from 0 (Not at all likely) to 10 (Extremely likely). Based on the score they give, customers fall into one of three categories:
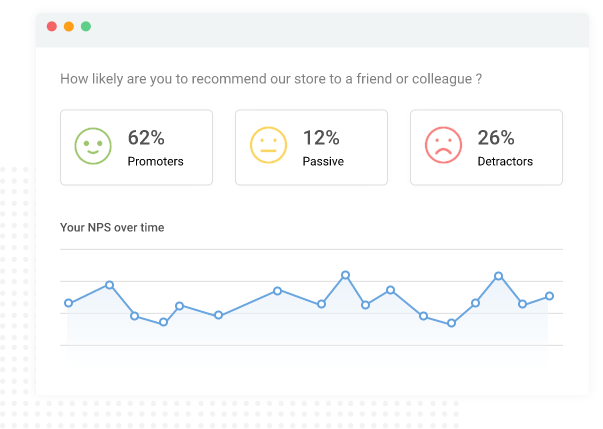
- Promoters (9–10): Happy, loyal customers who are highly likely to recommend your business. They are your brand advocates and tend to drive positive word-of-mouth.
- Passives (7–8): Satisfied but unenthusiastic customers. They aren’t actively recommending you, and could switch to a competitor if tempted. Passives are considered neutral in NPS — they don’t count toward your score.
- Detractors (0–6): Unhappy customers who are unlikely to buy again and may discourage others from doing business with you. Detractors are at high risk of churning and often provide negative reviews.
The Net Promoter Score itself is calculated by taking the percentage of respondents who are promoters and subtracting the percentage who are detractors. NPS is expressed as a whole number ranging from -100 (if every customer is a detractor) to +100 (if every customer is a promoter). A positive NPS (above 0) means you have more promoters than detractors, which is generally a good sign.
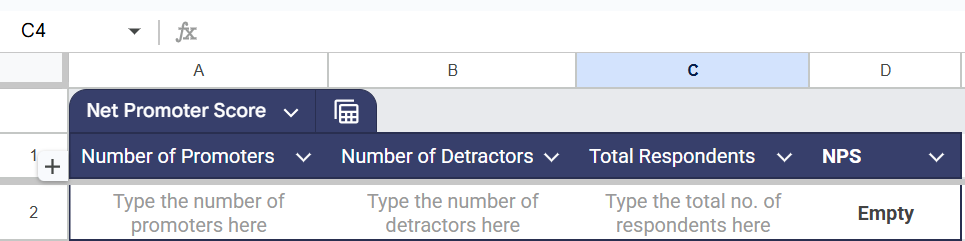
Here’s a quick calculator for you to calculate the NPS score:
NPS vs. CSAT vs. CES: When Should You Use Each?
While NPS measures overall loyalty, CSAT and CES focus on specific parts of the customer experience.
- CSAT (Customer Satisfaction Score) measures satisfaction with a specific interaction, such as a support call or purchase.
- CES (Customer Effort Score) measures how easy it was for customers to complete an action, like resolving an issue.
- NPS (Net Promoter Score) captures long-term loyalty and willingness to recommend your brand.
When to use each: These metrics work best together. Use CSAT after individual interactions, CES to identify friction in key processes, and NPS periodically to track overall loyalty trends. NPS gives you the big picture, while CSAT and CES help diagnose what’s driving the score.
Pro Tip: Send NPS surveys quarterly or biannually, and use CSAT or CES at important touchpoints. This approach gives you both strategic insight and actionable feedback.
Benefits & Limitations of NPS
Before calculating NPS, it’s important to understand why it’s widely used and where it falls short. Knowing both helps you interpret your score correctly and avoid common mistakes.
Benefits of NPS
- Simple and standardized: NPS uses a single question and a consistent formula across industries. This makes it easy to understand, share internally, and compare against benchmarks or competitors.
- Strong indicator of loyalty and growth: A higher NPS often reflects stronger customer loyalty and positive word-of-mouth. Promoters are more likely to stay longer, repurchase, and recommend your brand.
- Easy to collect at scale: Because the survey is short, customers are more likely to respond. This makes it practical to gather feedback from large audiences and track trends over time.
- Clear focus for improvement: By grouping customers into promoters, passives, and detractors, NPS helps teams prioritize follow-ups, especially with unhappy customers who need attention.
Limitations of NPS
- Doesn’t explain the “why”: The score alone doesn’t reveal what customers like or dislike. Without a follow-up question, NPS lacks the context needed to take action.
- Measures intention, not behavior: A high score reflects how customers feel, not what they actually do. Saying they would recommend doesn’t always translate into real referrals.
- Can be biased or unrepresentative: Response rates are often low, and people with strong opinions are more likely to reply. This means your score may not fully represent your entire customer base.
- Affected by cultural differences: Customers in different regions use rating scales differently. A “good” NPS in one country may look very different in another.
- Oversimplifies customer sentiment: Reducing feedback to one number removes nuance. Significant improvements in customer experience may not immediately reflect in the score.
- Not actionable on its own: NPS signals whether loyalty is rising or falling, but it doesn’t tell you what to fix. It works best when combined with follow-up feedback and other metrics.
- How to use NPS effectively: Always include an open-ended follow-up question, segment results by customer type or region, and pair NPS with metrics like CSAT, CES, retention, or churn. Used in context, NPS becomes a powerful indicator rather than a standalone score.
Now that we’ve covered what NPS is good for and where it has limits, let’s move on to how to calculate NPS step by step.
How to Calculate Net Promoter Score (NPS)
Calculating NPS is simple and follows the same formula across industries. You just need to collect responses, group them, and apply the formula.
Step 1: Send an NPS Survey
Ask customers one question:
“On a scale of 0 to 10, how likely are you to recommend our company or product to a friend or colleague?”
You can send this survey via email, in-app, website pop-ups, or SMS. Keep it short. Ideally, include just the rating question and one optional follow-up asking why they chose that score.
Step 2: Categorize Responses
Once responses come in, group them based on the score:
- Promoters: 9–10
- Passives: 7–8
- Detractors: 0–6
Start by counting how many responses fall into each category.
Step 3: Convert Counts Into Percentages
Calculate NPS by determining the percentage of respondents who are promoters and detractors.
For example, out of 100 responses:
- Promoters: 60 = 60%
- Detractors: 20 = 20%
(Passives are tracked but not used in the final calculation.)
Step 4: Apply the NPS Formula
Use this formula:
NPS = % of Promoters − % of Detractors
Using the example above: NPS = 60 − 20 = 40
NPS scores range from -100 to +100. A positive score means you have more promoters than detractors.
Step 5: Double-Check or Automate
You can calculate NPS manually using a spreadsheet or let an NPS survey tool do it automatically. Tools remove manual errors and make it easier to track trends over time.
Pro tip: NPS is reported as a whole number, not a percentage. You would say “Our NPS is 40,” not “40%.”
That’s it. Once you have your NPS, the real value comes from interpreting the score and acting on the feedback behind it.
FREE. All Features. FOREVER!
Try our Forever FREE account with all premium features!
Create Your NPS Survey in 4 Simple Steps
To make this practical, I’ll use ProProfs Survey Maker as an example, but the steps apply no matter which tool you use.
1. Pick an NPS Survey Template and Develop a Simple Plan
Start by selecting an NPS survey template that matches your goal, such as measuring overall customer loyalty or gathering feedback after a key interaction. With ProProfs Survey Maker, you can start from a ready-made template instead of building the survey from scratch. Before sending it out, decide who you’ll survey and when, so your results stay consistent over time.
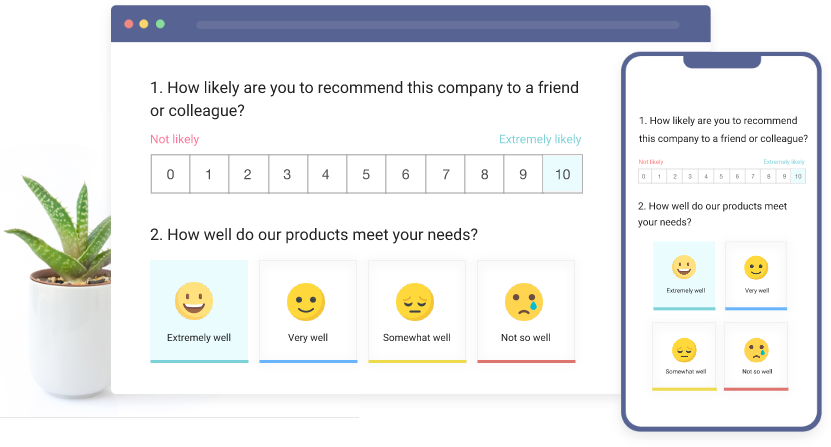
2. Add an Optional Follow-up Question
After the 0–10 rating question, add one optional open-ended question like, “What’s the main reason for your score?” This is where most of the value comes from. In ProProfs Survey Maker, this step is simple and keeps the survey short while still giving you meaningful feedback.
3. Customize It With Your Logo and Brand Colors
A branded survey feels more trustworthy and familiar to respondents. Using ProProfs Survey Maker as an example, you can easily add your logo and adjust brand colors so the survey looks like a natural extension of your business.
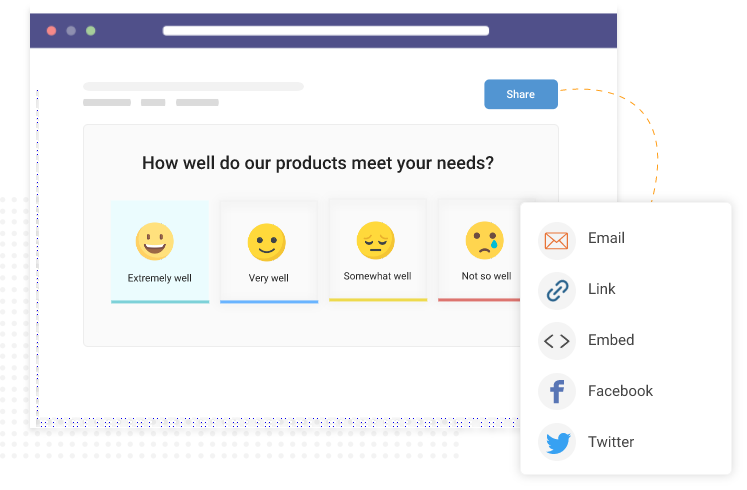
4. Share It as a Link, Email, or Embed It on Your Website
Once the survey is ready, choose the most convenient way for customers to respond. ProProfs Survey Maker lets you share the survey via a direct link, send it through email, or embed it on your website or inside your product, making it easy to collect feedback without friction.
Understanding and Interpreting NPS Results
Calculating NPS is only the first step. The real value comes from understanding what the score means, how it compares, and what actions to take next.
What Is a “Good” NPS?
There’s no single benchmark for a good NPS. Scores vary widely by industry, region, and whether you’re B2B or B2C. That said, these general ranges can help you interpret your score:
- Negative NPS: More detractors than promoters. This signals serious customer experience issues that need immediate attention.
- 0–30: Average or needs improvement. You likely have many passives and unresolved friction points.
- 30–50: Good. You have significantly more promoters than detractors and generally healthy customer relationships.
- 50–70: Excellent. This reflects a highly loyal customer base.
- Above 70: Exceptional and rare. Scores at this level usually indicate customer experience leadership.
Always benchmark against your own industry and competitors. A score that’s strong in one sector may be average in another.
Focus on Trends, Not Just the Number
An improving NPS over time matters more than a single number. Track trends quarterly or annually to spot early warning signs or positive momentum.
Segment Your NPS for Better Insights
Break results down by region, customer tenure, product plan, or customer value to uncover where loyalty is strong or weak.
Close the Feedback Loop
- Follow up quickly with detractors
- Learn from passives
- Thank and study promoters
Share NPS results and customer comments across teams so everyone understands what’s working and what needs fixing.
NPS Survey Types: Relationship vs. Transactional
Not all NPS surveys serve the same purpose. There are two main types.
1. Relationship NPS Surveys
These are sent periodically to measure overall loyalty and sentiment toward your brand. They capture the customer’s cumulative experience and are commonly used as a company-wide KPI. Most businesses send these quarterly, biannually, or annually.
2. Transactional NPS Surveys
These are triggered after specific interactions, such as a purchase, onboarding, or support interaction. They help identify which moments in the customer journey are improving or hurting loyalty.
Which Should You Use?
Ideally, use both. Relationship NPS shows the big picture, while transactional NPS pinpoints specific highs and lows. Just be mindful of survey frequency to avoid fatigue. Send surveys at meaningful moments, not after every interaction.
Best Practices for Conducting NPS Surveys
To calculate NPS accurately and get reliable and meaningful insights from your surveys, follow these proven best practices.
1. Keep the Survey Short
NPS works best as a lightweight survey. Stick to the rating question and one or two optional follow-up questions. If it takes more than a couple of minutes to complete, response rates drop.
2. Always Ask a Follow-Up Question
The score alone isn’t enough. Pair it with an open-ended question like, “What’s the main reason for your score?” This helps you understand what’s driving loyalty or dissatisfaction and gives you clear direction on what to improve.
3. Choose the Right Timing
Send surveys when the experience is still fresh but meaningful.
- Relationship NPS works well when sent periodically.
- Transactional NPS should be triggered shortly after a key interaction, once the customer has had time to form an opinion.
Avoid poor timing like holidays or inconvenient hours.
4. Prevent Survey Fatigue
Don’t send NPS surveys too often to the same customer. Limit relationship surveys to quarterly or less, and space out transactional surveys if someone has multiple interactions.
5. Encourage Honest Feedback
Make it clear that responses are confidential and used only to improve the experience. Avoid a blame-driven mindset internally. Customers are more honest when they feel safe sharing feedback.
6. Close the Loop
Have a plan before sending surveys.
- Follow up quickly with detractors to resolve issues.
- Review passives to identify small improvements.
- Thank promoters and reinforce what you’re doing right.
7. Share Insights Internally
NPS shouldn’t live in a dashboard alone. Share customer comments with teams and leadership to drive action and continuous improvement.
8. Use the Right Tools
NPS survey tools help automate distribution, scoring, tracking, and segmentation, allowing you to focus on acting on feedback instead of managing data.
FREE. All Features. FOREVER!
Try our Forever FREE account with all premium features!
Use NPS to Improve Customer Experience and Drive Growth
How to calculate NPS is just the starting point. The real value comes from how you use it. NPS works best when it’s part of a broader customer experience strategy, not a standalone number. Use it to regularly listen to customers, spot unhappy detractors early, learn from your promoters, and make meaningful improvements based on real feedback.
It’s also important to view NPS in context. Balance it with other metrics like CSAT and CES, be aware of its limitations, and focus on trends over time rather than obsessing over a single score.
To make this easier, many teams rely on an NPS survey tool to handle distribution, scoring, and reporting. Tools like ProProfs Survey Maker help automate NPS surveys, calculate scores instantly, and track promoters, passives, and detractors over time, so teams can focus less on manual work and more on taking action.
FREE. All Features. FOREVER!
Try our Forever FREE account with all premium features!
 We'd love your feedback!
What did you like & how can we make it even better?

 Thanks for your feedback!
 Ask Your Question
Have a question? Get expert help to make your decision easier.