Customers do not leave because they are unhappy. They left because it was too hard to stay. That is the core insight behind Customer Effort Score, and it is one of the most underused levers in customer experience management today.
Most teams are still chasing satisfaction scores and NPS while quietly losing customers at friction points they never measured.
CES fixes that by asking a direct question: how much effort did the customer have to put in?
Tools like ProProfs Survey Maker and Qualaroo let you deploy that question, so you catch friction before it becomes churn.
This guide covers:
- What the customer effort score is, and why it predicts churn better than satisfaction
- How to calculate CES using the right formula and scale for your context
- What a good score looks like by industry, with benchmark ranges
- How to create a CES survey and start collecting effort data today
Let’s begin.
How Do You Calculate Customer Effort Score?
Customer Effort Score (CES) is a customer experience metric that measures how easy or difficult it is for a customer to complete an interaction with your business. A lower score means less friction and stronger loyalty. It is calculated from a single survey question sent immediately after a key touchpoint..
What Is the Customer Effort Score Formula?
The customer effort score formula is straightforward. Add up all individual scores and divide by the total number of responses.
CES = Sum of All Scores / Total Number of Respondents
Here is a quick example. Say six customers rate their experience on a 1 to 5 scale, and their scores are 4, 3, 2, 4, 3, and 1.
CES = (4 + 3 + 2 + 4 + 3 + 1) / 6 = 2.83
For emoji-based surveys, calculate the percentage of happy versus unhappy responses out of total respondents. A 78% happy rate is your CES in that format.
What Is the Customer Effort Score Scale, and Which One Should You Use?
There is no single standard. Three formats are widely used, and each has a distinct use case.
Not sure which to pick? Use this as your 30-second rule:
| Your Situation | Use This Scale |
|---|---|
| Quick post-support or post-purchase survey, any industry | 1 to 5 Likert |
| B2B product, complex support interactions, need trend data | 1 to 7 Likert |
| Already running NPS or CSAT and want metric consistency | 1 to 10 |
| Mobile-first users or high-volume consumer contexts | Emoji / Smiley |
The 1-5 Likert Scale
Best for quick post-interaction surveys where you want low cognitive load on the respondent.
- 1: Strongly Disagree
- 2: Disagree
- 3: Neutral
- 4: Agree
- 5: Strongly Agree
Pair it with a statement like: “The support team made it easy to resolve my issue.”
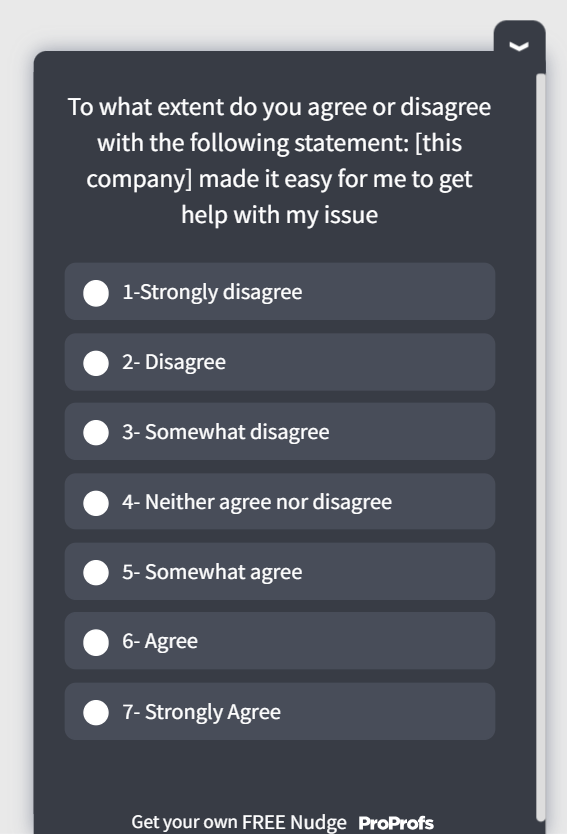
The 1-7 Likert Scale
Use this when you need more granularity, especially in B2B contexts where experiences are more complex.
- 1: Strongly Disagree
- 4: Neutral
- 7: Strongly Agree
The 7-point scale gives you a wider distribution to spot improvement trends over time.
The 1-10 Scale
Use this when your team is already running NPS or CSAT on a 10-point scale and wants consistency across metrics. Scores of 7 to 10 represent low effort (positive), and 1 to 3 represent high effort (a problem worth fixing).
Emoji or Smiley Scale
Three options: happy, neutral, unhappy. Best for mobile-first or consumer contexts where speed and simplicity matter more than precision. Calculate as a percentage of happy responses.
Pick one format and stick with it. Switching scales mid-stream makes trend analysis meaningless. Here’s an emoji CES template:
Here’s an example: A food delivery app sending a 3-emoji CES check immediately after order delivery gets 40% higher response rates than a 7-point scale. The interaction is simple, and the friction is still fresh.
When Should You Use a Customer Effort Score Survey?
Timing is everything with CES. The most accurate data comes from what practitioners call the “moment of truth window”: the 5 to 30 minutes immediately following a completed interaction.
Wait longer than that, and emotional memory starts to decay. Customers round their experience up or down to match their general mood, not the actual interaction. You end up collecting noise, not signal.
Here are the four best deployment moments:
1. After a Support Ticket Is Closed
Ask immediately once the ticket is marked resolved. Use the CES question alongside one open-ended follow-up: “What, if anything, made this harder than it should have been?” That second field is where you find the actual product and process issues.
2. After a Purchase or Transaction
Triggered post-checkout surveys catch friction in the buying flow. If customers are dropping off at checkout but not complaining, CES can surface the silent struggle before it becomes a churn event.
3. After Onboarding or Feature Adoption
Onboarding effort is one of the highest churn predictors in SaaS. A CES survey sent after the first meaningful product action (not the first login) tells you whether the path to value was clear or confusing.
4. After a Training or Knowledge Base Interaction
If a customer just watched a product tutorial or read a help article, CES tells you whether the resource actually resolved their question or sent them back to support. This is especially useful for teams trying to increase self-service deflection.
How Do You Create a CES Survey: Choosing the Right Tool for the Job?
Not all CES surveys serve the same purpose. The format you use and the tool you build it in should match the type of data you are trying to collect. Here is a simple way to think about it:
| Use Case | Best Fit | Why |
|---|---|---|
| Periodic or email-based CES (quarterly reviews, post-purchase follow-ups, multi-question formats) | ProProfs Survey Maker | Built for longer, structured surveys distributed via email, link, or embed |
| In-the-moment CES triggered by user behavior inside your product or website | Qualaroo | Built for short, contextual Nudges tied to specific actions or page visits |
Use ProProfs Survey Maker when you need a structured, multi-question CES survey distributed outside the product: via email after support ticket closure, as a post-purchase follow-up, as part of a quarterly relationship survey, or when you need a polished, branded format with detailed reporting across a larger respondent base.
The AI builder can also generate surveys from an uploaded document: drop in a PDF of your support process, and it’ll create targeted CES questions based on the content.
Here is how to build one in under five minutes using the AI builder:
Step 1: Describe Your Survey in One Sentence
Open ProProfs Survey Maker and type a plain-language prompt into the AI builder. Something like: “Post-support CES survey for SaaS users. Focus on ease of resolution, include an open-ended follow-up, and add an NPS question at the end.” That is all the input the AI needs.
Describe your survey and we'll create it for you
Step 2: Review the AI-Generated Survey
Within seconds, you get a complete survey with rating scales, open-text fields, and a logical question flow. The questions are neutral, with no leading language or built-in bias. It works across 70+ languages, so global teams are covered without extra setup.
Step 3: Refine and Brand It
Adjust any phrasing that does not match your voice. Add branching logic for low scores. Drop in your logo and match brand colors. The whole thing takes two to three minutes and looks polished without any design work.
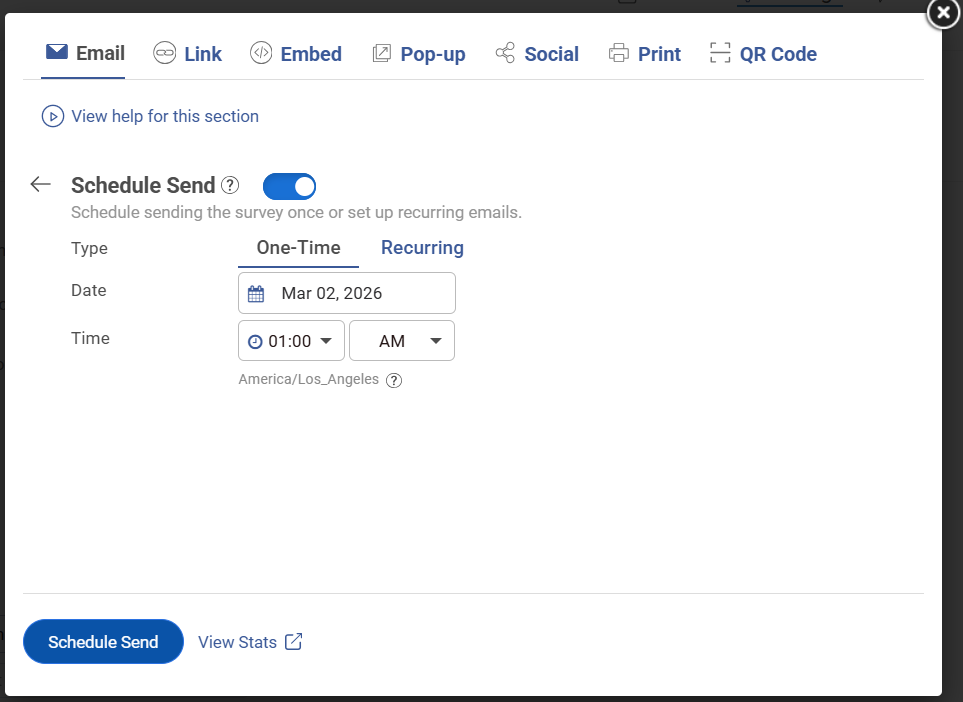
Step 4: Preview on Mobile and Launch
Preview on mobile before publishing, then choose your distribution method: email link, site embed, triggered popup, or QR code. You go from blank page to live survey in under five minutes.
Use Qualaroo when you need a one-to-three question CES check tied to a specific moment inside your product or website: right after a feature interaction, on a support page, at the exit point, or triggered by behavior like repeated page visits. The data is contextual, which makes it more actionable than anything collected hours later over email.
Qualaroo’s AI Sentiment Analysis automatically categorizes open-ended CES responses into sentiment data — so you’re not manually reading hundreds of text responses to find patterns. The word cloud surfaces the most common friction themes at a glance.
Here is how to set one up using Qualaroo’s pre-built CES template:
Step 1: Choose Your CES Template
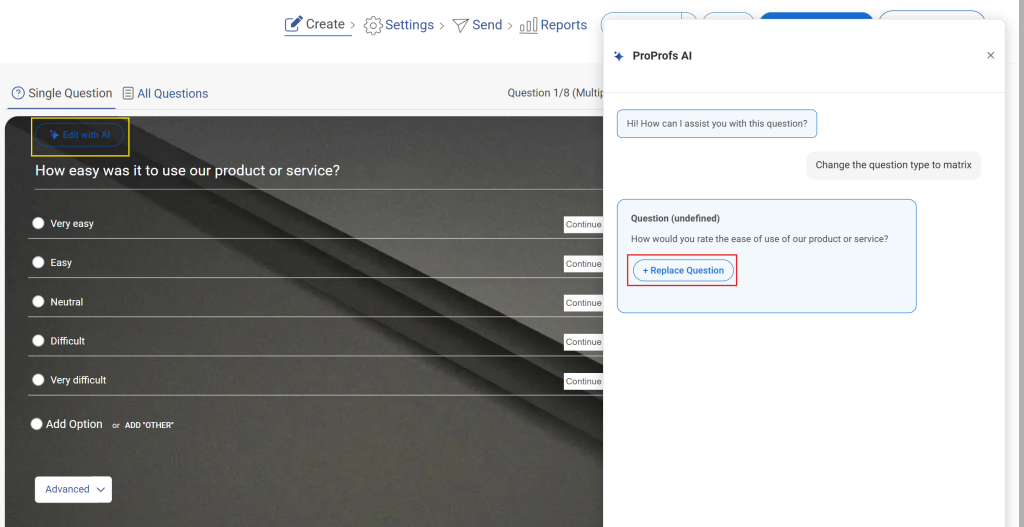
Start from the CES rating template so the core question and scale are already in place.
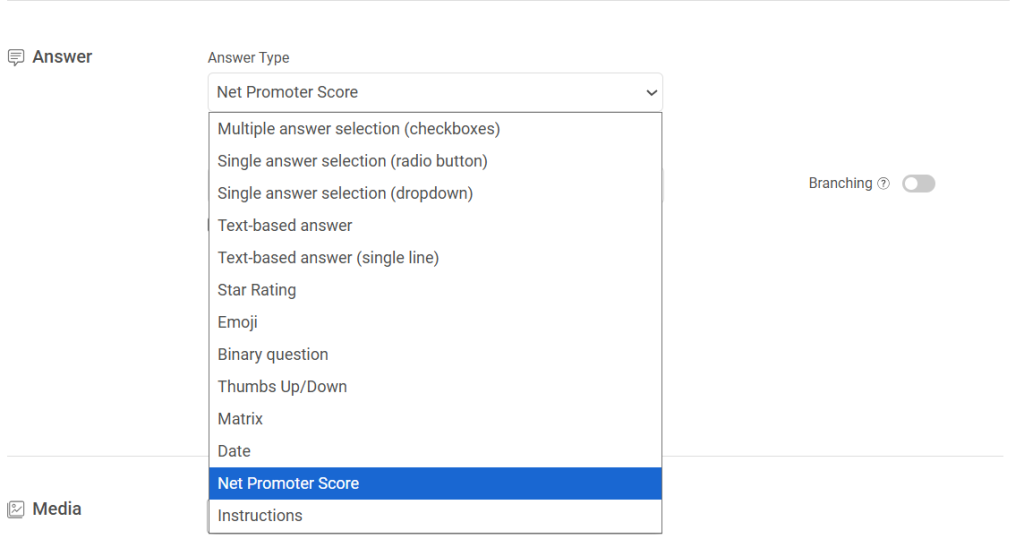
Step 2: Choose Your Answer Format
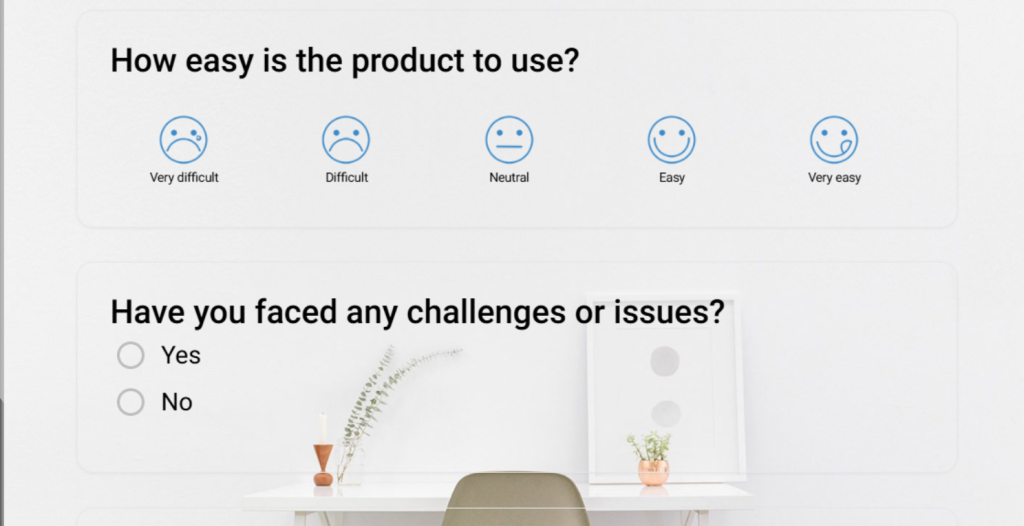
The CES template gives you a pre-written ease-of-interaction question ready to use. Pick the format that fits: a rating scale for a quantifiable score, an emoji scale for quick mobile responses, or a free-text box when you want the full story behind the friction.
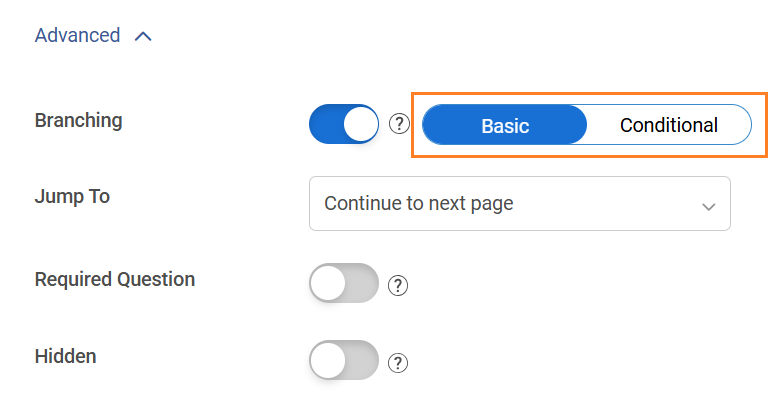
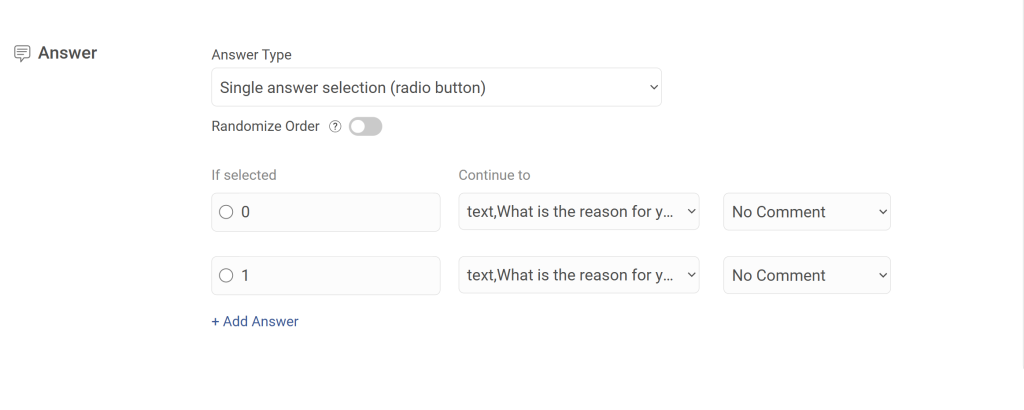
Step 3: Add Branching Logic
Set up branching so the survey adapts based on how someone answers. A frustrated user gets asked what went wrong. A satisfied user gets asked what worked. Same survey, two completely different follow-up paths, both relevant to the individual. Keep it to one to three questions so completion rates stay high.
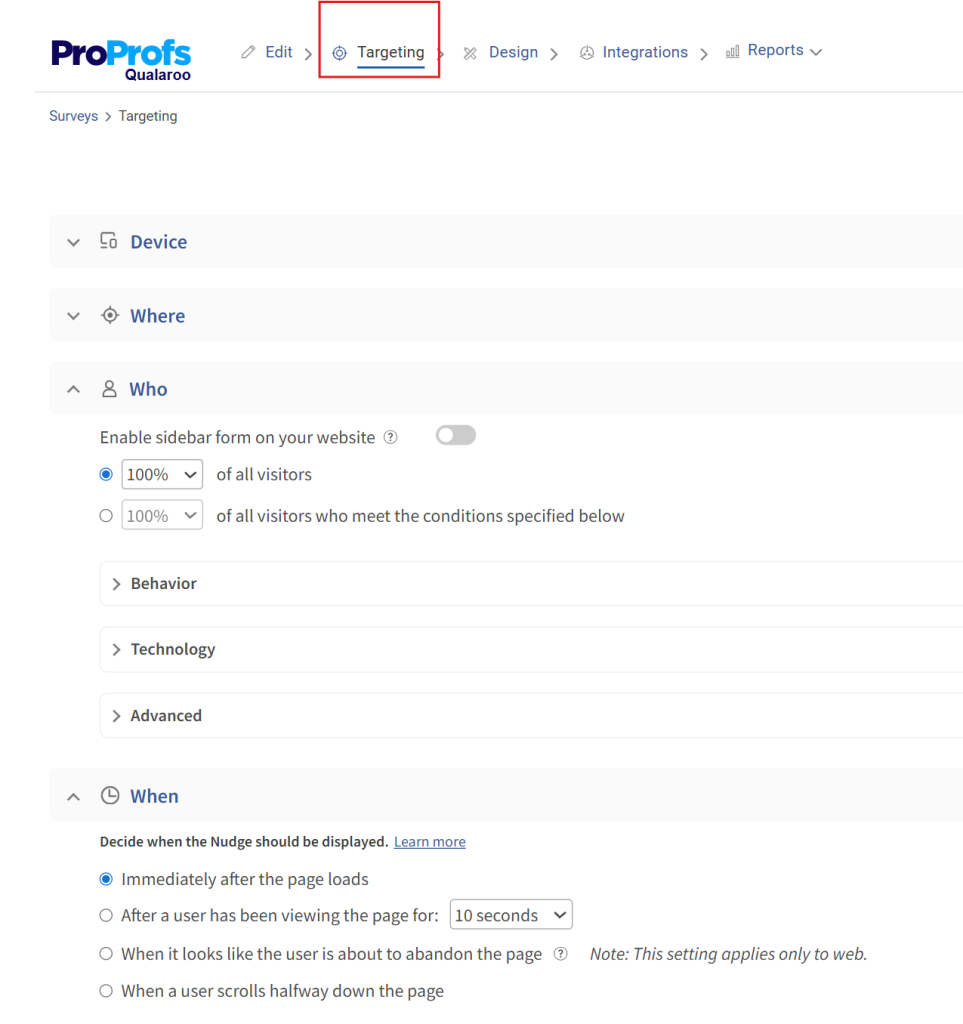
Step 4: Set Your Targeting Rules
Target by URL, user behavior, visit frequency, or a specific action just completed. A user who has visited your pricing page three times without converting sees a different question than someone who has just resolved a support ticket. Someone heading for the exit gets an exit-intent Nudge before they leave. Every response is tied to a real moment, which is what makes this data genuinely useful.
FREE. All Features. FOREVER!
Try our Forever FREE account with all premium features!
What Are the Best Customer Effort Score Questions to Ask?
Question phrasing makes a significant difference in both response rates and data quality. Impersonal, organization-centric language drops engagement. Human-centric phrasing performs consistently better.
Avoid This: “The organization made it easy to handle my issue.”
Use This Instead: “Did we make it easy for you to resolve your issue today?”
Or, if you know the agent’s name: “Did [Agent Name] make it easy for you today?”
That personalization shift alone increases the likelihood of a genuine, emotionally accurate response.
Here is a ready-to-use CES question set by touchpoint:
Post-Support Resolution
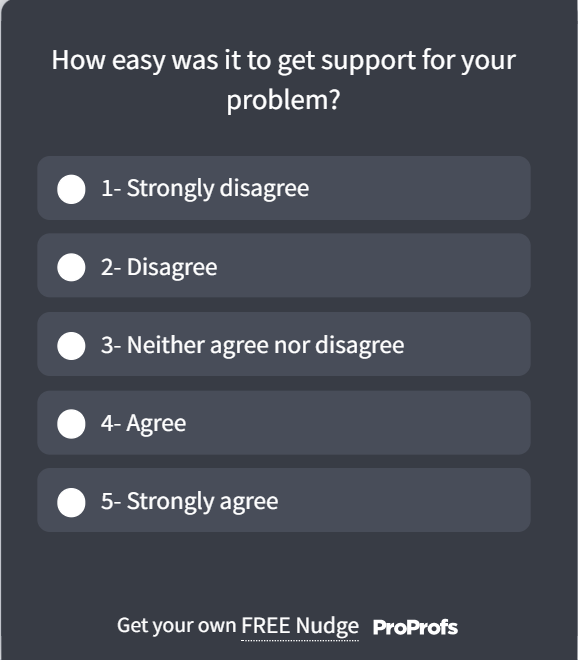
- “How easy was it to get your issue resolved today?” (1 to 5 scale)
- “What is the one thing that made this harder than it needed to be?” (open-ended)
Here’s a post-support template for you to use:
Post-Purchase
- “How easy was it to complete your purchase today?” (1 to 7 scale)
- “Was there anything in the checkout process that slowed you down?” (open-ended)
Here’s a post-purchase template for you to use:

Post-Onboarding
- “How easy was it to get started with [product name]?” (1 to 10 scale)
- “What was the most confusing part of getting set up?” (open-ended)
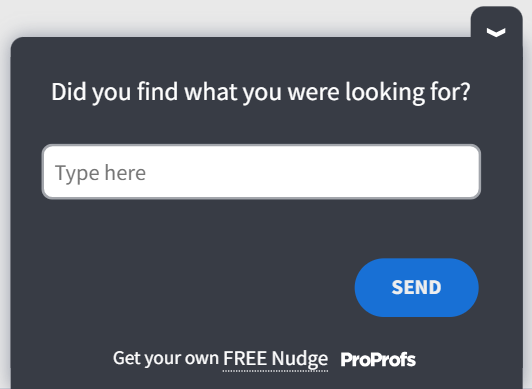
Post-Knowledge Base Visit
- “Did you find what you were looking for easily?” (emoji scale)
- “What were you trying to do when you visited this page?” (open-ended)
Here’s a post-page visit template for you to use:
Always pair your numeric CES question with exactly one open-ended follow-up. The number tells you the score. The text tells you what to fix.
Qualaroo makes it easy to deploy these micro-surveys at exactly the right moment, triggered by user behavior like ticket closure, page exit, or feature completion, so you capture feedback in that critical 5 to 30 minute window without adding friction to the experience itself.
How Do You Build a CES Improvement Playbook?
A good CES score does not happen by accident. It is the output of deliberate friction removal across your customer journey.

“You need to give your customers fewer reasons to be disloyal, and the best way to make that happen is to reduce customer effort.”
— Matthew Dixon, co-author of The Effortless Experience: Conquering the New Battleground for Customer Loyalty
In a world obsessed with delighting customers, this insight from CES pioneer Matthew Dixon flips the script. Instead of pouring resources into “wow” moments that often fail to drive loyalty, the real battleground lies in minimizing the friction customers experience when interacting with your brand.
Here is how to build a playbook that actually moves the number.
Step 1: Map Effort by Touchpoint
Before you can fix friction, you need to find it. Run CES surveys at every major touchpoint for 30 to 60 days. Segment scores by channel, agent, product area, and customer type. You will quickly see which touchpoints are creating disproportionate effort.
Step 2: Fix the Self-Service Layer First
Most customer effort happens when self-service fails. A customer who cannot find an answer in your knowledge base ends up calling support. A customer who cannot complete a simple task without help sends an email. Each escalation multiplies effort.
Audit your top 10 support ticket categories. For each one, ask: Is there a self-service path that should have resolved this? If not, build one. If yes, why did the customer not use it?
Step 3: Reduce Steps in Support Flows
Count the number of back-and-forth messages required to close a typical ticket. If the average is more than three, you have a resolution flow problem. Common fixes include:
- Better intake forms that capture issue context upfront
- Templated responses for the top 20 recurring issues
- Decision trees that route customers to the right agent faster
- Proactive follow-up instead of waiting for customers to chase
Step 4: Use Feedback Loops to Catch Regressions
CES is not a one-time audit. Set up a monthly review cadence where CES data by touchpoint is reviewed by the product, support, and UX teams together. Each session should answer two questions: where did effort go up, and what changed in that area?
Step 5: Layer in Passive Signals Between Survey Cycles
With global survey response rates averaging around 20-30% (according to Clootrack’s 2025 study), surveys alone will not give you the full picture.
Between cadences, track behavioral signals that flag high effort without waiting for a customer to respond: repeat contact rate on the same issue, average handle time by ticket category, self-service deflection failures, and rage click patterns on key product pages.
These signals catch friction before it shows up in your next CES cycle.
Step 6: Coach and Train Around Effort, Not Just Resolution
Support agents who close tickets quickly but make customers work hard along the way are not solving the right problem.
Train teams on effort-reduction habits: answer the implied next question, not just the stated one. Summarize what you have done at the end of each interaction.
Never make the customer repeat context they have already shared.
ProProfs Survey Maker lets you build and automate CES survey workflows across support, onboarding, and post-purchase touchpoints.
The AI builder generates the survey in seconds, and the built-in analytics surface response patterns so your team is not manually sifting through data to find where effort is spiking. There is a free plan with all core features if you want to test it against a single touchpoint before rolling it out broadly.
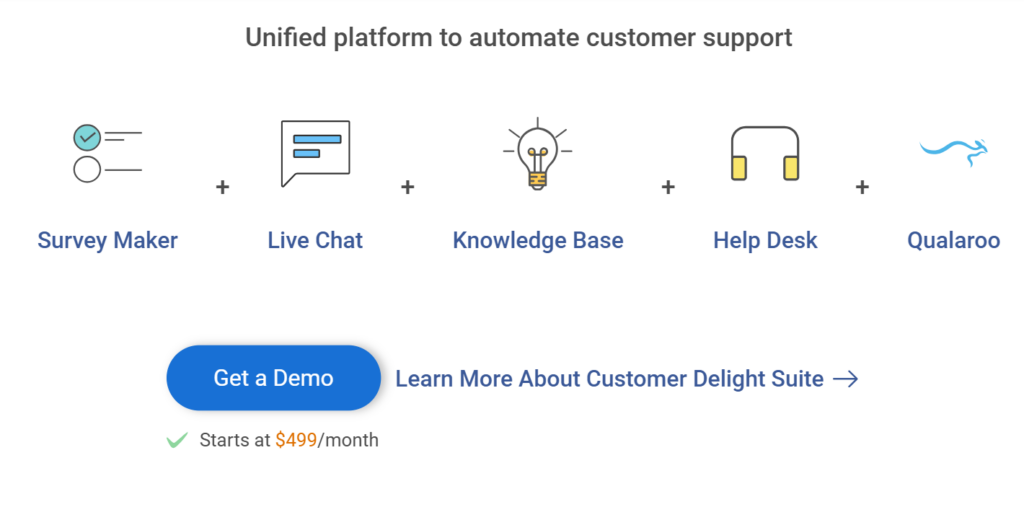
Furthermore, you can go for the complete customer delight suite for comprehensive customer support:
What Is a Good Customer Effort Score?
According to IBM, a good CES sits in the top 20% of your chosen scale. Here’s what that looks like across the three most common formats:
| Scale | Good CES Score | What It Means |
|---|---|---|
| 1–5 | 4.0 or above | Top 20%: customers found the experience easy |
| 1–7 | 5.6 or above | Top 20%: low friction across complex interactions |
| 1–10 | 8.0 or above | Top 20%: consistent with NPS/CSAT benchmarking |
The scale you use changes the number, not the standard. In every format, you are aiming for the top fifth of possible scores.
If you are below these thresholds, the score alone will not tell you why. That is why every CES survey should include one open-ended follow-up question. The number tells you there is friction. The text tells you where.
Real-World Result: From Friction Data to Revenue
GraphicSprings, a logo design platform, used Qualaroo’s in-product Nudges to ask users where they were getting stuck during the creation flow. The open-ended responses surfaced specific UX friction points the team hadn’t identified through analytics alone.
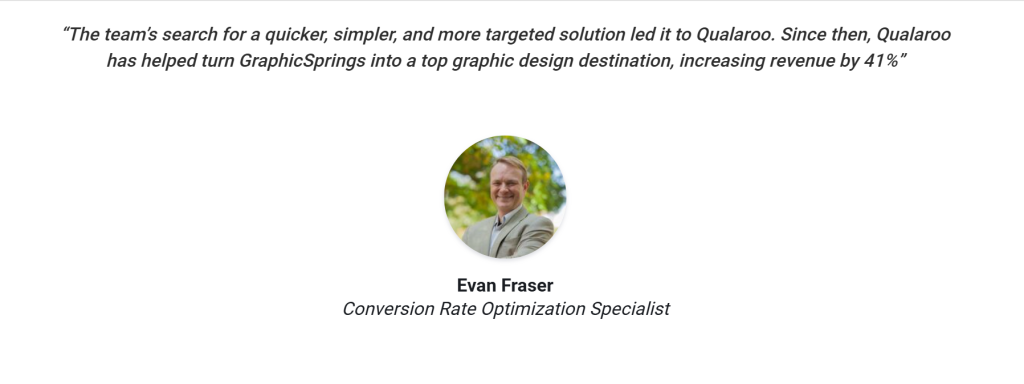
After fixing the highest-effort steps based on that feedback, GraphicSprings saw a 41% increase in revenue.
The takeaway: CES data is only as valuable as what you do with it. The score tells you effort is high. The open-ended follow-up tells you exactly where. Qualaroo’s behavioral targeting means you can ask the right question at the exact moment the friction happens, not an hour later when the memory has faded.
FREE. All Features. FOREVER!
Try our Forever FREE account with all premium features!
Start Measuring What Actually Drives Loyalty
Churn rarely comes with a warning. It builds quietly at friction points you are not measuring. CES is the metric that catches those moments before they compound into lost customers and negative word-of-mouth.
The framework is simple: pick your scale, deploy at the right touchpoints, pair every numeric question with an open-ended follow-up, and build a monthly review cadence that turns scores into action.
For structured, email-based CES surveys, ProProfs Survey Maker gives you AI-generated questions, ready-made CES templates, and automated workflows so you can start collecting data today. There is a free plan with all core features, so you can start with one touchpoint and scale from there.
For in-product and behavioral CES, Qualaroo lets you trigger micro-surveys based on exactly what a user just did inside your product or on your website, so every response is tied to a real moment rather than a fading memory.
Start with one touchpoint. Run it for 30 days. Review the data with your support and product teams together. That single cycle will show you more about where your customers are struggling than months of CSAT scores ever will.
Which customer effort score scale should I use?
Use the 1-5 scale for simple post-interaction surveys. Use the 1-7 scale in B2B contexts for greater granularity. Use 1-10 for consistency with NPS. Use emojis for mobile-first or consumer scenarios. Pick one format and stay consistent so the trend data stays comparable over time.
When is the best time to send a CES survey?
Within 5-30 minutes of a completed interaction. After that window, emotional memory starts to decay, and response accuracy drops. Trigger CES surveys automatically based on events such as ticket closure or purchase confirmation for the best results.
How is CES different from NPS and CSAT?
NPS measures overall brand loyalty. CSAT measures satisfaction with a specific interaction. CES measures the effort a customer had to exert. CES is more actionable for product and support teams because it points to specific friction rather than just overall sentiment. Most mature CX programs rotate all three rather than relying on any single metric.
Can CES be used for B2B companies?
Yes, and it is particularly effective in B2B because complex products and longer support cycles create more opportunities for high-effort experiences. Use the 1 to 7 scale and consider rotating CES with CSAT and NPS based on relationship stage rather than deploying all three at once.
What should I do with a low customer effort score?
Map the low score back to a specific touchpoint. Review the open-ended responses from that cohort to understand the "why." Identify whether the issue is in your self-service layer, support flow, product UX, or communication timing. Fix the highest-friction item first, then resurvey in 30 to 60 days to measure improvement.
What are passive signals, and how do they supplement CES data?
Passive signals are behavioral indicators of customer effort that do not require a survey response. Key signals to track alongside CES include: repeat contact rate (same issue, multiple contacts), average support handle time by category, self-service deflection failures, rage click patterns on key pages, and NLP flags in support transcripts for phrases like "I already explained" or "still not working." Build a simple effort index combining your CES score with two or three of these signals and review it monthly.
What are the advantages and disadvantages of the customer effort score?
CES is strong at identifying specific friction points, predicting churn early, and giving product and support teams something concrete to fix. Its limits: it does not capture external factors like pricing or competitive pressure, it misses the emotional and relational dimension that NPS tracks over time, and single-question formats make demographic segmentation harder. The strongest CX programs use CES alongside CSAT and NPS, rotating by lifecycle stage rather than relying on any one metric alone.
FREE. All Features. FOREVER!
Try our Forever FREE account with all premium features!
 We'd love your feedback!
What did you like & how can we make it even better?

 Thanks for your feedback!
 Ask Your Question
Have a question? Get expert help to make your decision easier.