



Ever wondered how we know which country is the happiest in the world?
It’s not just guesswork—it’s the power of quantitative research! By asking well-formulated quantitative research questions that measure life satisfaction, social support, income, and health, researchers can rank countries and decide who comes on top.
This is just one example of how quantitative research shapes our world and is a powerful indicator of what it can do for your business if used correctly.
This blog post is all about quantitative research questions — definition, types, methodologies, examples, and strategies to best utilize them.
Let’s get started.
What Are Quantitative Research Questions?
Quantitative research questions focus on obtaining tangible, measurable data and can be answered using numbers and statistical methods. They deal with aspects like amounts, comparisons, or relationships between variables.
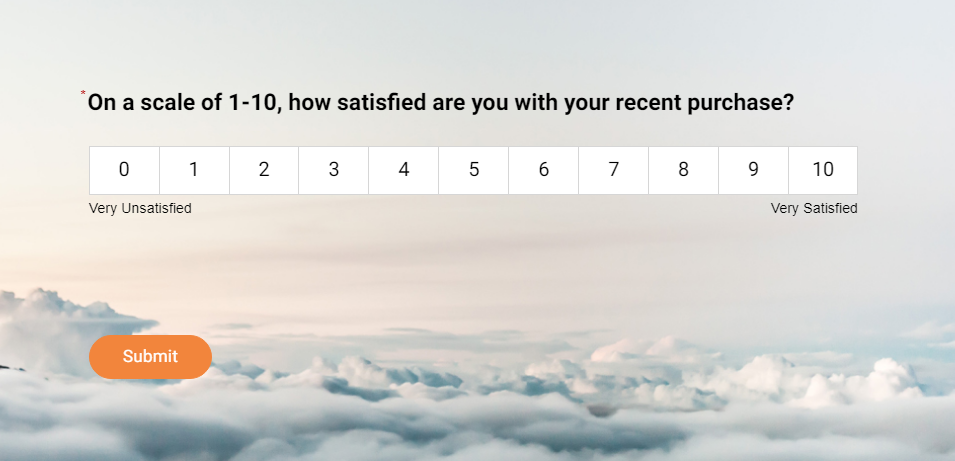
For example, quantitative data allows you to know exactly what percentage of consumers like a product or think you still need to improve. As a result of this precision, you can make decisions that are likely to be more in tune with the market demands.
How to Measure Customer Satisfaction with ProProfs Survey Maker: Quick & Easy
Research Questions vs. Survey Questions: What’s the Difference?
Before you write anything, it helps to separate the two kinds of questions that often get lumped together.
A quantitative research question guides your whole study. It states what you want to measure, compare, or relate, and it’s answered by your analysis, not by any single respondent. Your respondents never see it.
Survey questions are what respondents actually answer. Each one captures a single data point, and together they give you the numbers you need to answer your research question.
| Aspect | Research Question | Survey Question |
|---|---|---|
| Purpose | Sets the direction of the study | Collects one data point from a respondent |
| Who Answers It | You, through analysis | The respondent |
| Example | What percentage of employees are satisfied with their workplace environment? | On a scale of 1 to 5, how satisfied are you with your workplace environment? |
| How Many Do You Need | Usually one to three per study | Several per research question |
The examples in the next section are research questions. Further down, you’ll see how to turn one into survey questions you can actually send.
What Are the Different Types of Quantitative Survey Questions?
For quantitative research to be effective, your research question needs to point to something you can measure precisely and answer with numbers.
With that in mind, let’s look in greater detail at the three types of formats you can use, along with some quantitative research question examples.
1. Descriptive
Descriptive research questions describe a variable in your target group, such as how much, how often, or what share of people do or feel something. It is the most effortless way to measure the particular variable (single or multiple variables) you are interested in on a large scale. Usually, descriptive research questions begin with “ how much,” “how often,” “what percentage,” “what proportion,” etc.
Examples of descriptive research questions include:
- What is the average monthly income of households in City X?
- How many students prefer online learning over traditional classrooms?
- What percentage of employees are satisfied with their workplace environment?
- What is the median age of customers purchasing product Y?
- How often do people use public transportation in urban areas?
- What is the average daily screen time for teenagers?
- How many hours per week do working professionals spend on fitness activities?
- What is the most common reason for customer complaints in a call center?
- How frequently do people visit grocery stores in rural areas?
- What is the average grade point average (GPA) of students in University Z?
2. Comparative
Comparative research questions help you identify the difference between two or more groups based on one or more variables. In general, a comparative research question is used to quantify one variable; however, you can use two or more variables depending on your market research objectives.
Comparative research questions examples include:
- Is there a difference in academic performance between male and female students?
- Do urban and rural households differ in internet usage habits?
- Is the average salary higher in Company A compared to Company B?
- Do students in private schools score better than those in public schools?
- Are customer satisfaction levels higher for brand X compared to brand Y?
- Is there a significant difference in exercise frequency between men and women?
- Do individuals with postgraduate education earn more than those with undergraduate degrees?
- Is the recovery time faster for patients using treatment A compared to treatment B?
- Are sales higher during promotional periods compared to regular periods?
- Is job satisfaction higher among remote workers than office workers?
3. Relationship-Based
Relationship research questions examine whether two or more variables are connected, for example, whether one tends to rise or fall as another changes. They typically start with “What is the relationship between” or “Is there a correlation between” an independent and a dependent variable.
It’s important to be clear about which kind of relationship you’re asking about:
Association: Do the two variables move together? A standard survey can answer this.
Causation: Does a change in one variable produce a change in the other? A survey alone usually can’t answer this. Causal conclusions need a design built for it, such as a randomized experiment, a controlled before-and-after comparison, or long-term data that accounts for other factors.
If your study is a one-time survey, phrase your question as an association and report your results that way.
Association questions you can answer with a survey:
-
- What is the relationship between social media usage and self-esteem?
- Is there a correlation between daily exercise and self-reported stress levels?
- Is there a correlation between education level and income?
- What is the relationship between customer satisfaction scores and repeat purchase rates?
- What is the relationship between advertising frequency and sales revenue?
- Is daily screen time associated with self-reported sleep quality?
- What is the relationship between training hours completed and employee productivity scores?
- What is the relationship between daily temperature and cold beverage sales?
- What is the relationship between class attendance and exam performance?
Causal questions that need an experimental or long-term design:
- Does a new onboarding program increase 90-day retention compared to the current one, when new hires are randomly assigned to each?
- Does sending a reminder email increase survey response rates in an A/B test?
- Does reducing screen time before bed improve sleep quality in a controlled trial?
I dropped the smoking and lung disease example. That causal link comes from decades of long-term medical research, so listing it next to survey questions sends the wrong signal.
What Is the Importance of Quantitative Research Questions?
Quantitative research questions are the cornerstone of any well-designed study, offering clarity and direction from start to finish. They ensure that the research process is purposeful and produces meaningful insights. Here’s why they matter:
Make the Study Focused
These questions narrow down the scope of the research, ensuring you zero in on the right variables. By defining exactly what needs to be studied, they help prevent the research from wandering off track and make data collection more efficient.
Deliver Measurable Insights
Quantitative questions are designed to produce clear, numerical answers. This allows for precise measurement and consistent analysis using statistical tools. Standardized questions also make results easier to compare across groups and over time, though they only stay reliable when the wording is neutral and the sample reflects the people you want to understand.
Drive Clear Conclusions
With quantitative research, you can test hypotheses and evaluate patterns in the data. This approach ensures that conclusions are directly tied to the questions you set out to answer, making your findings both actionable and impactful.
Build Transparency and Trust
A well-framed question not only guides your study but also makes it easier to share your goals and results with others. And because these questions enable replication, other researchers can validate your findings, adding credibility to your work.
How to Write Quantitative Research Questions
Writing effective quantitative research questions involves crafting clear, focused, and measurable inquiries that guide your study. Here’s a simple guide to help you create them:
1. Start with Your Research Objective
Identify what you want to achieve with your study. Is it to measure, compare, or find relationships? For example:
- Measure: What is the average time customers spend on our website?
- Compare: Is there a difference in satisfaction levels between new and returning customers?
- Find Relationships: What is the relationship between social media engagement and sales?
2. Focus on Variables
This includes independent variables (what you compare or expect to explain a change) and dependent variables (the outcome you measure). In most surveys, you don’t manipulate anything. You measure both variables as they are, which is why survey-based relationship questions describe associations, not causes.
Example: What is the relationship between the number of training hours (independent variable) and employee productivity scores (dependent variable)?
3. Make Them Specific and Measurable
Avoid vague wording. Your research question should name something you can count, rate, or rank. Instead of “Do employees like their work environment?” ask, “What percentage of employees rate their work environment 4 or higher on a 5-point satisfaction scale?” The survey question your respondents see would then be: “On a scale of 1 to 5, how satisfied are you with your work environment?”
4. Choose the Right Type of Question
Quantitative research questions typically fall into three types:
- Descriptive: To describe a variable. What is the average age of customers who purchase product X?
- Comparative: To compare groups or conditions. Is there a difference in test scores between students in urban and rural schools?
- Relationship-Based: To explore connections. What is the relationship between study time and academic performance?
5. Keep It Clear and Concise
Ensure your questions are easy to understand and free of unnecessary jargon. They should be direct and to the point, leaving no room for misinterpretation.
6. Translate Your Research Question Into Survey Questions
Your research question tells you what to measure. Your survey questions are how you measure it. Here’s how one HR objective moves from a broad goal to questions respondents can answer.
Research Objective: Find out whether new hires who complete more onboarding training feel more confident in their roles.
Research Question: What is the relationship between hours of onboarding training completed and self-rated job confidence among employees in their first 90 days?
Variables:
- Independent Variable: Hours of onboarding training completed
- Dependent Variable: Self-rated job confidence
- Other Factors to Account For: Department and prior experience
Survey Questions:
| Variable | Survey Question | Response Format |
|---|---|---|
| Training Hours | In your first 90 days, about how many hours of formal onboarding training did you complete? | Multiple choice: 0 to 5, 6 to 10, 11 to 20, more than 20 |
| Job Confidence | How confident do you feel performing the core tasks of your role? | 5-point scale: 1 = Not at all confident, 5 = Extremely confident |
| Job Confidence | How confident are you that you know who to ask when you’re stuck? | Same 5-point scale |
| Department | Which department do you work in? | Dropdown |
| Prior Experience | How many years of experience did you have in a similar role before joining? | Multiple choice: None, less than 1 year, 1 to 3 years, more than 3 years |
If your LMS already tracks training hours, use those records instead of asking. Self-reported hours are easy to misremember.
Analysis Plan: Average the two confidence items into one score, then check the correlation between training hours and that score, comparing results across departments and experience levels.
What You Can Conclude: If confidence rises with training hours, you’ve found an association. To claim the training causes higher confidence, you’d need to compare similar groups of new hires assigned to different training programs.
Building rating scales by hand is where wording slips and unbalanced options creep in. ProProfs Survey Maker’s Likert scale and rating question types, along with 1,000,000+ ready-to-use questions, give you consistent scales to start from, and skip logic routes respondents past questions that don’t apply to them.
FREE. All Features. FOREVER!
Try our Forever FREE account with all premium features!
Qualitative Vs. Quantitative Questions: What’s the Difference?
Research is often driven by questions, and the type of question determines the methodology. Qualitative and quantitative research questions represent two distinct yet complementary approaches, each suited to different research objectives.
While qualitative questions seek to explore the depth of experiences and motivations, quantitative questions focus on measuring variables and analyzing numerical data.
Understanding the difference is critical for designing effective studies and ensuring that the research process aligns with the desired outcomes.
| Row | Replace | With |
|---|---|---|
| Data Collection Methods | (typo) | Data Collection Methods |
| Sample Size (Quantitative) | Large, representative | Larger; needs to be representative to generalize |
| Results (Quantitative) | Objective, structured, generalizable | Structured, comparable, generalizable only with a representative sample |
Quantitative Research Questions
- Objective: The primary goal of quantitative research questions is to quantify phenomena and provide measurable insights. These questions are often hypothesis-driven, aiming to test specific theories, establish statistical relationships, or compare variables across different groups.
Examples:
- What percentage of customers rate their satisfaction with our product 8 or higher on a 10-point scale?
- What percentage of employees report feeling engaged at work?
- Is there a relationship between study time and exam performance among college students?
Quantitative questions are ideal for studies where standardization and numerical precision are necessary, such as market analysis, demographic studies, or experimental research.
- Data Collection: Quantitative questions rely on structured and standardized methods of data collection to ensure consistency and replicability. These methods focus on predefined variables, enabling researchers to collect data systematically from a large and diverse sample.
Common Methods:
- Surveys with multiple-choice or scaled questions
- Controlled experiments with independent and dependent variables
- Observational studies with standardized checklists
- Questionnaires using Likert scales for attitudes and opinions
Example Data Collection Question:
- On a scale of 1 to 5, how likely are you to recommend our product to a friend?
- Data Analysis: Quantitative data is analyzed using statistical methods to identify patterns, trends, and relationships. Techniques range from simple descriptive statistics (mean, median, mode) to complex inferential methods (regressions, t-tests, ANOVA) for testing hypotheses.
Example Analysis:
- Determining the correlation between customer satisfaction scores and repeat purchase rates.
- Using ANOVA to compare employee productivity across different departments.
Statistical analysis makes conclusions easier to check and replicate. Whether they apply to a larger population depends on how the sample was drawn and how well the questions were written, not on the analysis alone.
- Sample Size: Quantitative research often involves larger sample sizes to enhance statistical power and ensure representativeness. A larger sample increases the reliability of the results and reduces the margin of error in generalizing findings to a broader population.
Example: Conducting a survey with 1,000 participants to evaluate nationwide consumer preferences.
That said, a large sample doesn’t fix a biased one. If 1,000 responses all come from your most engaged customers, the margin of error shrinks, but the results still won’t reflect customers who rarely engage. How you recruit respondents matters as much as how many you get.
- Results Presentation: Quantitative findings are typically presented in structured formats like tables, graphs, charts, and numerical summaries. These visual aids make it easier to interpret the data and compare variables.
Examples:
- A bar graph showing the percentage of respondents selecting each satisfaction level.
- A scatter plot illustrating the relationship between age and social media usage.
- Generalizability: Quantitative findings can be applied to a larger population when the sample represents that population, ideally through random or stratified sampling. Findings from a convenience sample, such as whoever happened to answer an email survey, describe those respondents, not everyone.
Qualitative Research Questions
- Objective: Qualitative research questions aim to explore the deeper “why” and “how” of human behavior, experiences, and social phenomena. They focus on gaining insights into underlying motivations, perceptions, and contexts, often leading to rich, detailed narratives.
Examples:
- Why do customers prefer brand A over brand B?
- How do employees perceive the new workplace policies?
- What are the experiences of students transitioning to online learning?
These questions are exploratory, allowing researchers to uncover themes and patterns that may not be immediately apparent.
- Data Collection: Qualitative questions require open-ended and flexible methods of data collection, encouraging participants to share their perspectives in their own words. This allows for a deeper exploration of individual or group experiences.
Common Methods:
- In-depth interviews with participants
- Focus group discussions to gather diverse perspectives
- Observational studies to understand behaviors in natural settings
- Analysis of documents, journals, or multimedia content
Example Data Collection Question:
- Can you describe a time when you felt particularly satisfied with our product?
- Data Analysis: Qualitative data analysis involves interpreting words, behaviors, or visual content to identify themes, patterns, and relationships. Researchers often use techniques like thematic analysis, narrative analysis, or grounded theory.
Example Analysis:
- Identifying recurring themes in customer feedback, such as “ease of use” or “poor customer support.”
- Analyzing interview transcripts for phrases that reflect employees’ workplace satisfaction.
- Sample Size: Qualitative research typically involves smaller, purposefully selected samples. The focus is on gaining depth rather than breadth, making it possible to explore individual cases in detail.
Example: Interviewing 15 participants to study their experiences with remote work during the pandemic.
- Results Presentation: Findings in qualitative research are often presented in narrative form, supported by direct quotes or case studies. This style emphasizes the richness and diversity of participants’ perspectives.
Example:
- A case study describing how a specific customer uses a product to overcome challenges.
- A narrative summarizing the emotional experiences of employees adapting to hybrid work models.
- Generalizability: Qualitative research does not prioritize generalizability. Instead, it seeks to provide a deep understanding of a specific context, group, or phenomenon. The findings are valuable for generating hypotheses or exploring areas that quantitative methods might overlook.
Tips for Creating Quantitative Research Questions
Creating precise and impactful quantitative research questions is essential for collecting meaningful data and achieving your research goals. Below is a structured guide to ensure your questions are clear, measurable, and aligned with your objectives. Tips 1 to 4 and 6 apply to your research question. Tips 5 and 7 to 10 apply to the survey questions your respondents will answer.
1. Start with a Clear Objective
Define what you want to achieve through your research. Your objective should inform the type of questions you create, whether to measure relationships, compare groups, or quantify variables.
Example: If your objective is to measure customer satisfaction, you might ask: “What percentage of customers rate their satisfaction as “very high”?
2. Ensure Measurability
Quantitative research questions must focus on measurable elements to allow statistical analysis. Use numeric scales, frequencies, percentages, or categories to frame your questions.
Example: Instead of asking, “Do students like online learning?”, ask: “What is the average satisfaction score students give online learning platforms on a 1 to 5 scale?”
3. Be Specific and Focused
Avoid vague or overly broad questions. Narrow down your scope to a specific variable, population, or context to ensure clarity and relevancy.
Example: Instead of asking, How does work affect health? ask: “What is the relationship between weekly work hours and reported stress levels among IT professionals?”
4. Align with Research Types
Your question should match the type of quantitative research you’re conducting:
- Descriptive Questions: Focus on measuring variables.
- What is the average daily screen time for teenagers aged 13-18?
- Comparative Questions: Compare differences between groups.
- Is there a significant difference in exam scores between students who study in groups and those who study alone?
- Relationship-based Questions: Identify correlations between variables. Causal questions need an experimental design.
- What is the correlation between income level and spending on luxury goods?
5. Use a Clear and Neutral Language
Ensure your questions are free from bias or ambiguity. Avoid leading questions that could influence respondents’ answers.
- Example of a Leading Question:
- Do you agree that our product is the best in the market?
- Revised Neutral Question:
- How would you rate your satisfaction with our product on a scale of 1 to 10?
6. Define Your Variables Clearly
Identify the dependent and independent variables in your research. Ensure your question explicitly addresses their relationship or measurement.
Example: What is the relationship between hours spent exercising weekly (independent variable) and body mass index (dependent variable)?
7. Focus on One Issue at a Time
Avoid double-barreled questions that combine multiple issues, as they can confuse respondents and compromise data accuracy.
- Example of a Poor Question:
- Do you think our product is affordable and easy to use?
- Revised Question:
- How would you rate the affordability of our product?
8. Choose the Right Question Type
Select question formats that align with your research needs:
- Closed-Ended Questions: Allow for easy quantification (e.g., multiple-choice, Likert scales).
- How frequently do you shop online? (Daily, Weekly, Monthly, Rarely)
- Rating Scales: Measure intensity or satisfaction.
- On a scale of 1 to 5, how would you rate your experience?
9. Consider Your Target Audience
Tailor your questions to suit the respondents’ understanding and context. Use simple, straightforward language that matches their demographic and expertise.
10. Pilot-Test Your Questions
Before launching your research, test your questions with a small sample to identify ambiguities or issues in wording. Make adjustments based on feedback to ensure clarity and effectiveness.
Final Checklist for Your Quantitative Questions:
|
Numbers Don’t Remove Bias on Their Own
Numerical data feels objective, but bias can enter well before you run a single calculation. Watch for these:
Sampling Bias: Your respondents don’t reflect the group you want to describe.
Nonresponse Bias: The people who skip your survey differ from those who answer it.
Wording Bias: Leading or loaded questions push respondents toward certain answers.
Scale Bias: Unbalanced answer options (three positive, one negative) skew results.
Interpretation Bias: Reading a correlation as proof of cause and effect.
Good quantitative research reduces these risks through careful sampling, neutral wording, and pilot testing. It doesn’t eliminate them automatically.
Strengthen Your Research With Quantitative Research Questions
So, there you have it. It was all about quantitative research question types and their examples. By now, you must have figured out a way to write quantitative research questions for your survey to collect actionable customer feedback.
To ensure success, focus on writing clear, concise questions tailored to your goals. Avoid ambiguity, test your survey before launch, and always align your questions with the type of data you wish to collect. This approach will help you maximize the value of your research.
Start with a good survey tool like ProProfs Survey Maker, which comes with an AI Survey Maker to make the process of designing surveys a breeze. You also get access to various survey question types, both qualitative and quantitative, that you can add to any kind of survey, along with professionally designed survey templates.
Learn More About Quantitative Survey Questions: FAQs
1. When to Use Quantitative Research Questions?
Quantitative research questions are ideal when your study focuses on measurable outcomes, testing hypotheses, or identifying patterns and relationships. Use them to collect numerical data, compare groups, or identify trends across populations. They’re particularly effective when you need consistent, comparable results that can be tested statistically and, with a representative sample, applied to a larger population.
2. Why Use Quantitative Questions?
Quantitative questions provide structured, measurable data that can be analyzed statistically. They make responses comparable across groups and over time, and they reveal trends or relationships between variables. Their findings carry over to a larger population only when the sample represents that population and the questions are free of bias.
3. What Is the Difference Between a Research Question and a Survey Question?
A research question defines what your study is trying to find out, such as the share of employees satisfied with their workplace. A survey question is what respondents actually answer, such as rating their own satisfaction on a 1 to 5 scale. One research question usually needs several survey questions to answer it properly.
4. Can Quantitative Research Prove Cause and Effect?
It can, but only with the right design. A one-time survey can show that two variables are related, not that one causes the other. To support a causal claim, you need a randomized experiment, a controlled comparison, or long-term data that accounts for other factors that could explain the result.
FREE. All Features. FOREVER!
Try our Forever FREE account with all premium features!

 We'd love your feedback!
What did you like & how can we make it even better?

 Thanks for your feedback!
 Ask Your Question
Have a question? Get expert help to make your decision easier.