You can tell a bad survey design within ten seconds. Too long, too plain, and too clueless about how real people think. Most surveys aren’t broken because of the questions. They’re broken because of the design.
If you’ve ever built one that looked perfect in theory but flopped in practice, you already know. Survey design is not an afterthought. It’s the difference between useful data and noise you can’t explain in a meeting.
The fix isn’t complicated. You just need to design like someone who’s answering, not analyzing. That means clear flow, smart logic, and a structure that respects attention spans.
In this guide, you’ll learn how to design a survey that gets finished, gets real answers, and actually earns insight.
What Is a Survey Design?
Survey design is how you plan, structure, and present questions so people actually answer them, and so their answers mean something. A solid design maintains a natural flow and keeps the data clean. A weak one turns your results into guesswork.
Think of it like building a customer journey. Every question shapes how someone feels as they move through it. When the flow makes sense, people finish without friction. When it doesn’t, they click out and never come back.
Good survey design starts before you write a single question. You decide who you’re talking to, what you need to learn, and how those answers will translate into action later. That’s what separates meaningful insight from a pile of numbers you can’t defend in a meeting.
In practice, survey design is more about experience than theory. You’re building a system that captures real behavior, not polite guesses. The goal is simple: make it easy for people to be honest and easy for you to make sense of what they said.
Now, let’s look at two common survey frameworks that shape how you collect and analyze data.
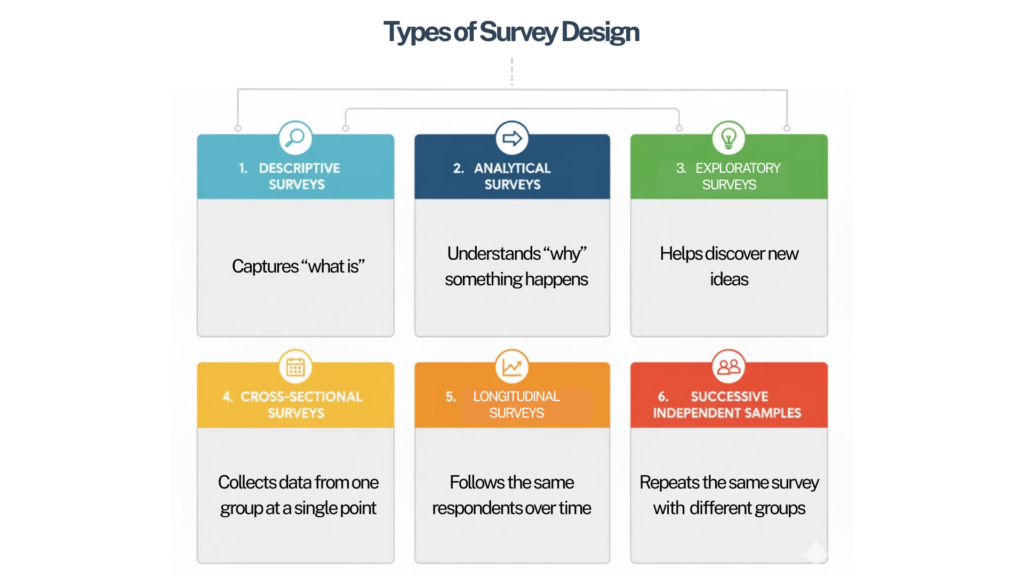
Types of Survey Design & When to Use Each
Survey design sets the rhythm for how you collect and interpret data. Each design serves a different goal. Pick the one that matches what you want to learn and how you plan to use the results.
1. Descriptive Surveys: Capturing What Exists
Descriptive surveys show the current state of things. They tell you what people think, feel, or do right now, without digging into why. Use them when you need a snapshot of opinions or behaviors — like customer satisfaction, product feedback, or employee morale.
2. Analytical Surveys: Finding What Drives Outcomes
Analytical, or causal, surveys go deeper. They explore how one factor affects another, revealing why results happen the way they do. Use them to understand relationships, such as how customer service quality influences loyalty or how pricing impacts buying decisions.
3. Exploratory Surveys: Discovering the Unknown
Exploratory surveys help you learn what you don’t yet know. They’re used early in a project when you’re still defining the right questions to ask. Open-ended formats work best here. They uncover themes, pain points, and insights that guide your next round of research.
4. Cross-Sectional Survey Design: Taking a Snapshot in Time
Cross-sectional surveys collect data from one group at a single point in time. They’re fast and efficient, perfect for quick reads like campaign feedback or market benchmarking. The results show how people think today, not how that thinking evolves over time.
5. Longitudinal Surveys: Tracking Change Over Time
Longitudinal surveys follow the same group across multiple points in time. They help you see progress, patterns, and long-term trends. Use them to track employee engagement, product adoption, or shifting brand perception.
6. Successive Independent Samples: Comparing Without Tracking
Sometimes you can’t follow the same people over time. Successive independent samples address this issue by surveying different groups with the same questions. The results reveal population-level shifts while protecting individual anonymity.
Here’s how each type works and where it fits best.
| Survey Design Type | What It Does | When to Use It |
|---|---|---|
| Descriptive | Captures “what is” — current opinions, behaviors, or conditions without exploring causes. | Use when you need a snapshot of a market, team, or audience. Perfect for satisfaction or feedback surveys. |
| Analytical (or Causal) | Studies relationships between variables to understand “why” something happens. | Ideal for finding drivers of satisfaction, purchase intent, or engagement. Often paired with statistical analysis. |
| Exploratory | Helps discover new ideas when you’re unsure what questions to ask yet. | Use early in survey research design to identify themes, pain points, or emerging opportunities. Often uses open-ended questions. |
| Cross-Sectional | Collects data from one group at a single point in time. | Great for quick decisions, benchmarking, or campaign analysis. |
| Longitudinal | Follows the same respondents over time to reveal changes and trends. | Use for tracking customer retention, product adoption, or employee engagement. |
| Successive Independent Samples | Repeats the same survey with different groups over time to spot shifts without following individuals. | Ideal when privacy or turnover prevents tracking the same respondents. |
Quick Tip: Match your design to your goal.
- Need a snapshot? Go descriptive or cross-sectional.
- Need to learn causes? Go analytical.
- Need early discovery? Go exploratory.
Need to track progress? Go longitudinal or successive samples.
How to Design a Survey & Best Practices for Survey Design
Survey design is not a form to fill out. It is a system you build to get honest, valuable data. Every question, click, and transition affects whether people finish or drop off. So, you don’t need jargon, rather flow, logic, and structure that earns attention one click at a time.
Here’s how to build that:
1. Start with Purpose & Clarity
Before you write a single question, decide what success looks like. A survey without a goal only collects noise. You need one clear purpose that shapes every part of your design.
Ask yourself three questions before you start:
- What do I want to learn?
- Who do I need to hear from?
- What decision will this data help me make?
If you can’t answer those in one line, stop and fix the goal first. It will change everything that follows — your wording, your flow, even the type of data you’ll end up analyzing.
Example: If your goal is “Measure customer satisfaction,” that’s too broad. A better goal is “Find what part of onboarding makes new users drop off.” That single change gives your survey a clear purpose and a finish line.
Write the goal at the top of your draft. Every question must earn its place by serving that goal. If it doesn’t, delete it.
A Note on Sampling and Representativeness: Deciding who should take your survey is as important as what you ask. A small, focused sample that truly represents your target audience is worth more than a thousand random clicks.
- Match your audience to your goal. For example, talk to new customers if you’re improving onboarding, not everyone in your database.
- Avoid convenience sampling when accuracy matters.
- When in doubt, aim for variety within your segment rather than sheer volume.
A clear goal and the right audience are what make data meaningful. Everything else builds on that foundation.
2. Choose the Right Tool for the Job
The tool you build with decides how smooth the entire process will be. Look for flexibility. You should be able to personalize the look, add logic that adapts to each response, and review results without exporting a dozen spreadsheets. The tool should make your work easier, not more technical.
A while back, our team built a customer study on a platform that looked simple but collapsed when we added logic. Halfway through, we switched to ProProfs Survey Maker because we could design our surveys instantly using AI and it handled branching and branding without code. That change saved us time and gave us data we could trust.
Here’s a video to learn more about branding your surveys:
When you pick your tool, make sure it’s ready for everyone who might take the survey. Accessibility is part of design, not an afterthought.
Quick Accessibility and Mobile-First Checklist:
- Use readable fonts and strong color contrast.
- Label all input fields clearly for screen readers.
- Test that users can move through every question using only a keyboard.
- Keep tap areas large and layouts vertical for mobile screens.
- Preview the full survey on a small phone before you share it.
When your tool makes the survey usable for everyone, you earn more completions and fewer complaints. Accessibility, speed, and trust all start with what you build on.
3. Build a Logical & Adaptive Flow
A strong survey moves like a good conversation. Each question should feel like a natural next step, not a test. When the flow clicks, people stay engaged and answer honestly. When it doesn’t, they drift, guess, or quit halfway through.
Start simple. Ease people in before you ask for effort. Then keep related questions together so the context stays clear and consistent. A scattered sequence forces people to switch focus, which kills momentum. You can use branching logic to make the experience personal.
- Skip questions that don’t apply to a respondent.
- Route people based on their answers so they see only what’s relevant.
- Remove dead ends. Every answer should lead somewhere useful.
Test your own survey before launch.
- Take it once as a designer to check the function.
- Take it again as a respondent to check the flow.
- If you find yourself re-reading or losing interest, tighten it up.
A smooth flow is invisible. It quietly moves people from the first click to the final submit without them noticing the structure behind it. That’s when you know the design works.
4. Keep It Short and Focused
Length is the fastest way to lose a respondent. The longer a survey feels, the more people rush, guess, or drop off before finishing. A long survey doesn’t mean better data. It usually means confused data.
Keep it lean. Most surveys should take less than ten minutes. If you can collect what you need in five, that is ideal. Every question must have a reason to exist.
Ask yourself:
- Does this question support my main goal?
- Will the answer change a decision I make?
- Can two questions be merged into one?
If the answer is no, remove it. Short surveys get better completion rates and more thoughtful responses. People give honest answers when they are not tired or frustrated.
Short surveys attract attention, but how you invite people matters just as much.
- Set Expectations Clearly: Tell them how long it will take.
- Personalize Invitations: Use names or relevant context instead of a generic link.
- Pick the Right Time: Send it when your audience is most active, not when your team is.
- Follow Up Once: A Friendly reminder often doubles completion rates, but too many feel pushy.
- Keep Your Tone Human: People respond to people, not systems.
Strong design gets them to open the survey. Clear, respectful outreach gets them to finish it.
5. Write Clear and Neutral Questions
The quality of your data depends on how you frame each question. Confusing or biased wording leads people to the wrong answers, and no amount of analysis can fix that later.
Keep every question simple and specific. Avoid jargon, double meanings, or anything that forces people to interpret what you meant. Write questions that anyone can understand on the first read.
The goal is to make it easy for people to express what they think and for you to analyze it later.
- Multiple Choice: Best for quick, structured answers that fit defined categories.
- Likert Scales: Great for measuring attitudes or satisfaction on a sliding scale.
- Ranking Questions: Use these when you want people to prioritize options. Keep the list short — five to seven items max — so results stay meaningful.
- Semantic Differential Scales: Pair opposites like easy–difficult or trustworthy–untrustworthy to capture how people feel, not just what they think.
Pick the format that makes the analysis simple. For example, if you only need a yes or no, do not add a five-point scale. Every extra option is extra noise unless it serves your goal.
Avoid these common traps:
- Double Questions: “How satisfied are you with our support and pricing?” Split that into two.
- Leading Questions: “How amazing was our new update?” That signals the answer you want.
- Absolutes: Words like always or never box people into answers that rarely fit reality.
Keep your tone neutral. You are collecting information, not defending a product. Neutral phrasing makes people more honest, especially when the topic is sensitive or emotional.
Add a neutral or skip option such as “Prefer not to answer” or “Not applicable.” Forcing people to choose when an answer doesn’t fit makes the data unreliable.
Read your questions out loud. If they sound like something you would never say in a conversation, rewrite them. Clarity always beats cleverness.
6. Test, Refine & Repeat
A survey is never right the first time. Even the cleanest design looks different when real people start clicking through it. Testing is where good surveys become great.
Start with a small pilot. Share the survey with a few people who match your target audience. Watch how long they take, which parts make them pause, and where they drop off. You will spot problems that no spreadsheet could ever show.
Fix what you find, then run it again. Even one extra round of testing can double your completion rate.
Look for these signals:
- People re-reading questions instead of answering.
- Confusion about which options apply.
- Sudden drop-offs at a specific question or section.
Once it runs smoothly, review the data structure. Make sure the results are easy to filter, compare, and segment later. Good design doesn’t end when someone hits submit; it continues into how you use what they gave you.
Question Types That Work & How to Analyze Them
Once your survey is live, question design decides how rich your data will be. Each format collects a different kind of insight, so the goal is to know what to use, when to use it, and how to read the results.
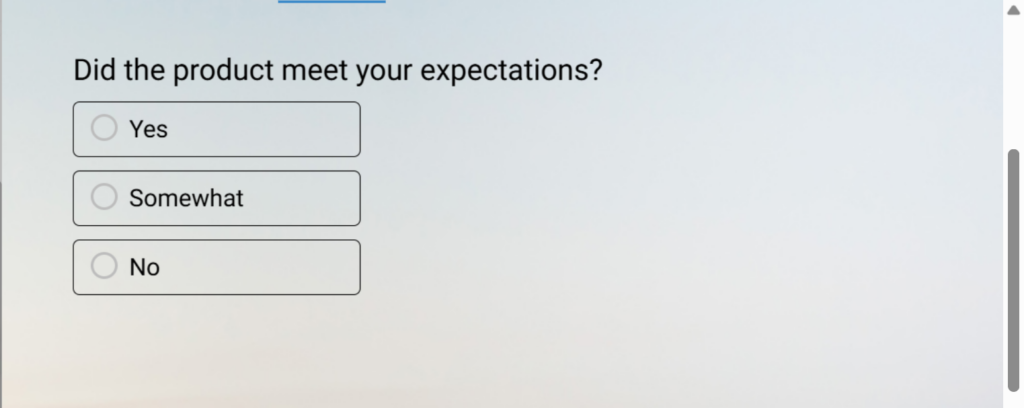
1. Closed-Ended Questions: These include multiple choice, ratings, and scales. They’re easy to answer and analyze because responses are structured. Use them when you want quick comparisons or measurable trends.
Examples:
- How satisfied are you with our onboarding process?
- Which feature do you use most often? (Feature A, Feature B, Feature C)
- Did our support team resolve your issue? (Yes / No)
Here’s a quick sample template you can tweak & use:
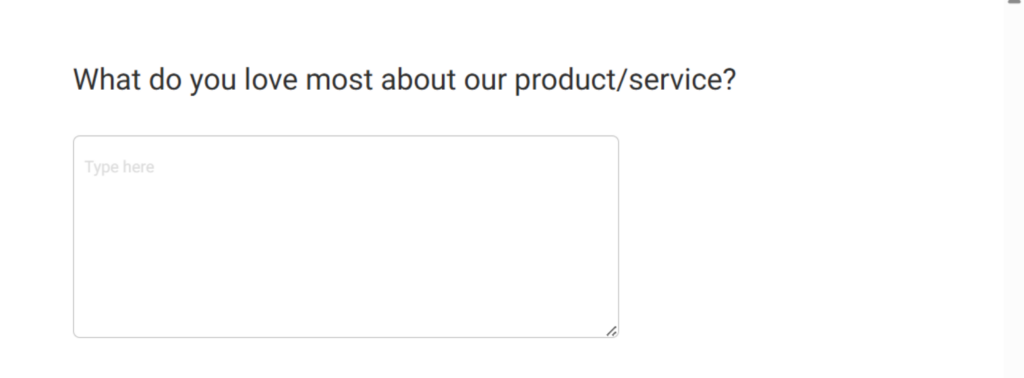
2. Open-Ended Questions: These capture emotion and reasoning. Open-ended survey questions may take longer to analyze, but reveal what numbers can’t. Use them sparingly and give enough space for thoughtful answers.
Examples:
- What is one thing we could do to make your experience better?
- How would you describe our product to a friend?
- What was the most challenging part of using our service?
Here’s a sample template for open-ended questions:
3. Ranking Questions: Use when you want to see priorities. Keep the list short so answers stay meaningful. When analyzing, focus on the top few rankings — that’s where intent lives.
Examples:
- Rank the following product features in order of importance.
- Arrange these factors based on what most influences your buying decision: price, quality, ease of use, or customer support.
- Order these communication channels from most to least preferred.
Here’s a ranking question template for you to use:
4. Rating and Scale Questions: Likert or semantic differential scales measure intensity. Five- or seven-point ranges work best. Use even-numbered scales only if you want to force a side; use odd-numbered ones if neutrality matters.
Examples:
- On a scale of 1 to 5, how satisfied are you with your recent purchase?
- How strongly do you agree with the statement: “The checkout process was simple.” (1 = Strongly disagree, 7 = Strongly agree)
- How easy was it to navigate our website? (Very difficult to Very easy)
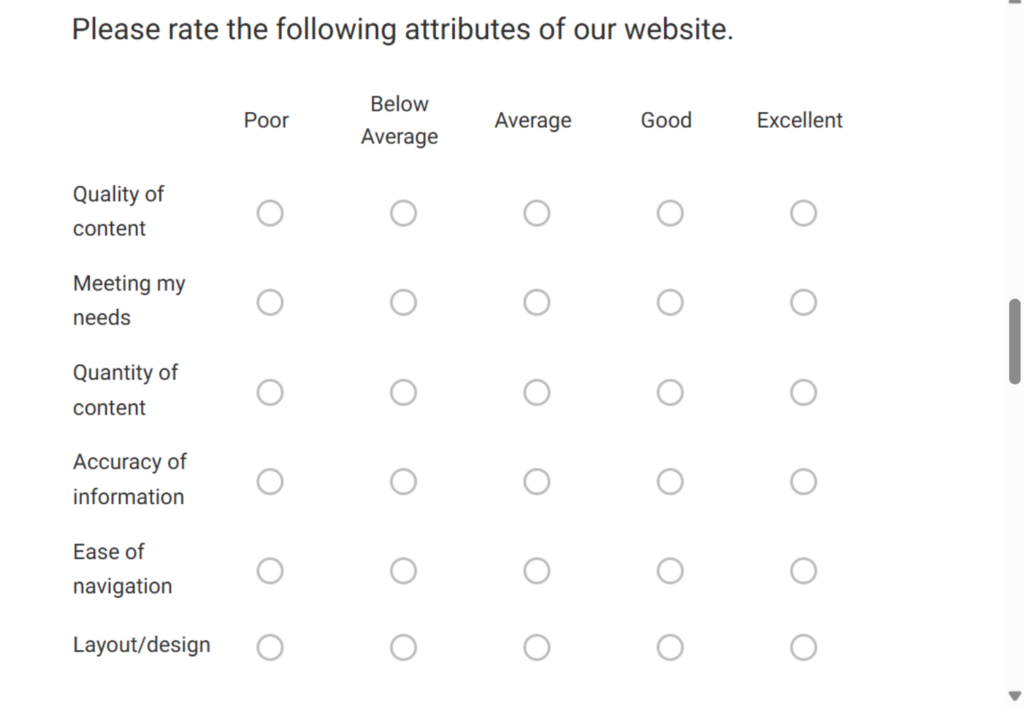
Here’s a rating survey sample template for you to leverage:

5. Comparative Analysis: Once results are in, turn raw answers into patterns.
- Convert ranking data into weighted scores.
- Average rating scales to identify satisfaction gaps.
- Group open-ended responses by recurring themes.
Once responses are in, you can:
- Compare results between customer groups, time periods, or product lines.
Identify satisfaction gaps by averaging scores. - Cluster open-ended feedback by recurring themes to see what drives customer loyalty or frustration.
Examples:
- How satisfied are you with our product? (Used to compare satisfaction by user type, new vs. existing customers.)
- Which department do you belong to? (Enables analysis of responses across teams.)
- How often do you use the platform? (Lets you compare usage patterns with satisfaction or NPS scores.)
Here’s a sample template for market research and comparative analysis for you:
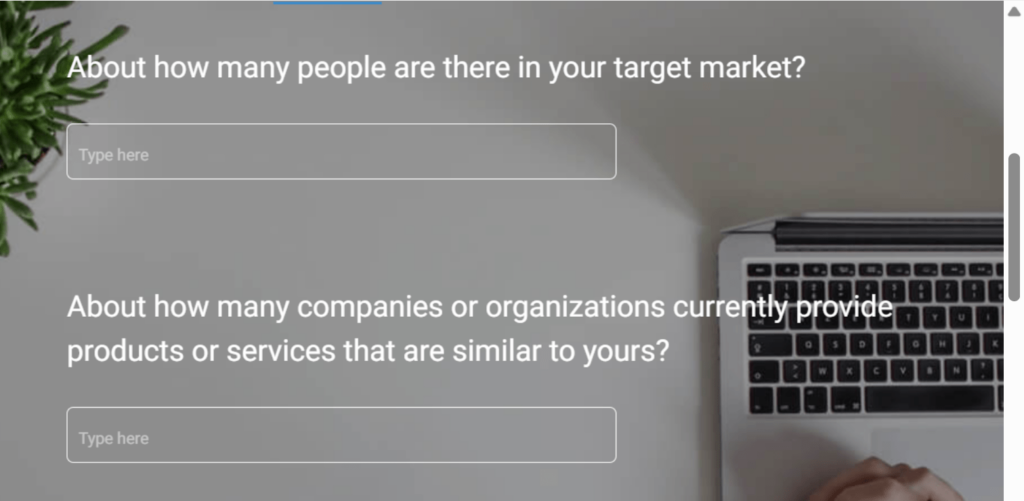
Image-Based Answer Choices: Sometimes words slow people down. When respondents can see the options instead of reading them, they decide faster and answer more accurately. Image-based answer choices are especially useful for design-driven questions like product packaging, logos, UI layouts, or visual preferences. They also make surveys feel more interactive and engaging, which improves completion rates—especially on mobile.
Examples:
- Which logo feels more trustworthy? (Show 3 logo options)
- Which product packaging would you pick first? (Show mockups)
- Which homepage layout looks easier to use? (Show screenshots)
Keep images the same size to avoid bias, add short labels under each option for clarity, and make sure visuals load fast. Done right, image choices reduce confusion and help you capture cleaner, more reliable feedback. Here’s a complete video to show you how to add images to your surveys:
The right question type makes data analysis faster and insights clearer. When your survey is built for both the respondent and the analyst, the story writes itself.
FREE. All Features. FOREVER!
Try our Forever FREE account with all premium features!
Common Mistakes in Survey Design & How to Fix
Even experienced teams trip over the same few mistakes. Avoiding them can instantly lift your response rates and data quality.
| Mistake | What Happens | How to Fix It |
|---|---|---|
| No Clear Goal | The survey collects random data that doesn’t lead to decisions. | Define one primary goal before writing questions. Build everything around it. |
| Too Many Questions | People rush or quit halfway through. Data loses depth and honesty. | Keep only what supports your goal. Fewer questions mean better answers. |
| Double-Barreled Questions | Respondents get confused by mixed topics and give unreliable answers. | Split every complex thought into two simple questions. |
| Biased or Leading Language | The wording nudges respondents toward one answer. | Use neutral phrasing that doesn’t assume or suggest. |
| Poor Flow or Missing Logic | The survey feels random and tiring. Completion rates drop fast. | Group related questions and use branching logic to personalize flow. |
| Ignoring Mobile Experience | Questions cut off or buttons misalign on smaller screens. | Test every survey on mobile before launch. Keep layouts simple and tap areas large. |
| Skipping Pretests | Hidden errors and confusing questions go live. | Run a short pilot with a few people. Fix friction before wide release. |
From Design to Insight: Turning Responses into Action
Collecting responses is only half the work. The real value appears when those answers shape what you do next. Survey data matters only when it moves from a dashboard into real decisions.
Start by reading through the results with intent. Look for patterns that repeat. Notice what people mention often or where their tone changes. Those are the clues that point to what really needs attention.
Organize your data for clarity:
- Compare new users with long-time customers to spot differences in experience.
- Sort feedback by product line, region, or department to find where issues cluster.
- Filter responses by satisfaction level to see what drives positive or negative scores.
- Randomize answer order to prevent pattern bias.
- Add one or two attention checks to confirm people are reading.
- Watch for speeders — responses completed much faster than the average time.
- Remove duplicates that come from the same user or device.
These are simple habits that separate accurate findings from background noise.
Good survey design makes this process faster. When the logic is clean and questions are consistent, the data almost organizes itself. You spend time learning, not fixing.
Turn those findings into action:
- Share: Insights with your team so everyone sees the same reality.
- Prioritize: What to improve, based on what matters most to customers or employees.
- Close the Loop: Tell respondents what changed because of their feedback. That single step turns one-time participants into long-term contributors.
- Segment results by audience type or stage.
- Look for gaps between groups or over time.
- Pick one or two changes that will have the biggest impact.
- Implement those changes and share the outcome.
- Repeat to refine your next survey.
Treat this as a repeating cycle: design, collect, act, refine. Each round teaches you how to ask smarter and execute better.
Why Great Survey Design Matters
A survey is more than a set of questions. It’s a mirror of how you think about your audience. When it’s designed well, people feel understood. When it’s careless, they feel like data points.
Good design turns participation into partnership. It shows respect for people’s time, attention, and honesty. When the experience feels natural and clear, people tell you the truth. That truth is what builds better products, stronger teams, and smarter strategy.
Poor design does the opposite. It hides insight under clutter and bias. You can collect thousands of responses and still have nothing you can act on. The problem isn’t the audience; it’s the experience you built for them.
Design decides trust. It decides accuracy. It decides whether your next decision is based on signal or noise. That’s why survey design deserves the same care you give to a product launch or marketing campaign.
The payoff is simple. A well-designed survey earns better answers, cleaner data, and stronger relationships. It turns research from a task into a conversation — one that people actually want to have again.
Improve Survey Design & Capture Better Insights
Good design does more than collect data. It builds alignment between what you want to learn and what people are willing to share. It turns feedback into focus and your audience into partners who actually want to respond.
Tools matter too. The right platform helps you design faster, test smarter, and listen at scale. For instance, ProProfs Survey Maker makes it easier to design intuitive surveys that have the right balance of question types and engaging visuals. That’s the kind of support every team needs (software that helps you hear people better).
When your design is purposeful, and your tools stay invisible, insight becomes automatic. You stop chasing responses and start learning from them.
Frequently Asked Questions

What are the 5 principles of surveying?
Good surveys follow five principles: clarity, neutrality, flow, brevity, and purpose. Every question should be easy to understand, unbiased, logically ordered, short enough to keep attention, and directly tied to the survey’s goal. Together, these principles ensure accuracy, engagement, and reliable insight.
Is survey design quantitative or qualitative?
Survey design can be both. Quantitative designs use closed-ended questions to collect measurable data, while qualitative designs rely on open-ended questions to capture opinions and reasoning. The best surveys blend both, offering numbers that explain what is happening and narratives that explain why it happens.
What are the 7 steps to creating a good survey?
Creating a good survey involves defining your goal, choosing the right tool, building a logical flow, writing clear questions, keeping it short, testing it, and refining based on feedback. Each step improves completion rates, data quality, and overall experience for both you and your respondents.
How does survey logic improve response quality?
Survey logic personalizes the journey for each respondent. By showing only relevant questions, it reduces fatigue and confusion. This tailored flow keeps people engaged and ensures the data you collect reflects accurate, thoughtful answers instead of rushed or irrelevant responses.
FREE. All Features. FOREVER!
Try our Forever FREE account with all premium features!
 We'd love your feedback!
What did you like & how can we make it even better?

 Thanks for your feedback!
 Ask Your Question
Have a question? Get expert help to make your decision easier.