ProProfs Survey Maker Editorial Team is a diverse group of professionals passionate about survey creation and market research. We update you on the latest trends, dive into technical topics, and offer insights to elevate your business.
Every survey you run is a bet. You are betting that the people answering read the questions, meant what they clicked, and were not a bot trying to grab an incentive.
Most of the time, that bet pays off. Sometimes it does not, and you only find out after a decision has already been made on flawed numbers.
That is what a data quality survey check really is. It is not a special kind of survey.
It is the habit of verifying that the data you collected can actually be trusted, and building your survey in a way that makes bad data easier to spot before it reaches a spreadsheet.
This guide walks through what that means in practice.
We will cover how to build a cleaner survey from scratch using ProProfs Survey Maker’s AI Survey Maker, the exact questions that catch low-quality respondents, why bad data happens in the first place, and the checks you should run before you trust a single number.
This shows up differently depending on your team.
An HR pulse survey with straightlined responses can mask a real disengagement problem before it reaches leadership.
A CX team relying on a rushed NPS score might chase a false low that wasn’t actually there.
A marketing team scoring inbound leads on a rigged qualification survey ends up handing sales a pile of bad leads.
The checks below work the same way, no matter which one you’re running, but the stakes look different for each.
What Is a Data Quality Survey?
A data quality survey check is the process of evaluating whether survey responses are accurate, complete, consistent, and free of fraudulent or careless input before they are used to make a decision. It includes both the design choices that prevent bad data from entering your dataset and the checks that catch it afterward.
Let’s break that down into something you can actually use. When people talk about data quality, they are usually referring to one of four issues.
It helps to think of them as four separate questions you can ask about any dataset in front of you.
Quality dimension
The question it answers
What it looks like when it fails
Accuracy
Does this answer reflect what the person actually thinks
Random clicking, guessing at questions they do not understand
Completeness
Did the respondent finish the parts that matter
Partial submissions, skipped required sections
Consistency
Do related answers agree with each other
Rating a feature 9 out of 10, then listing it as their biggest complaint
Authenticity
Is this a real, qualifying respondent
Bots, duplicate entries, and panel members answering just for a reward
Here is why this framework matters more than it sounds like it should. Most teams treat data quality as one big, vague worry.
But when you break it into these four specific questions, the fix for each one becomes obvious.
A completeness problem is fixed with a better survey flow.
An authenticity problem is fixed with verification steps.
You cannot fix what you have not named, and this table gives you the names.
ProProfs Survey AI Coach
Ask anything about surveys, feedback, and user insights
","text/html");
function clean(node){
if(node.nodeType===3){var t=node.textContent.replace(/\s+/g," ").trim();return t?t:"";}
if(node.nodeType!==1)return "";
var tag=node.tagName;
if(!allowed[tag])return Array.prototype.map.call(node.childNodes,clean).join("");
if(tag==="BR")return " ";
var inner=Array.prototype.map.call(node.childNodes,clean).join("");
if(tag==="A"){
var href=(node.getAttribute("href")||"").trim();
if(!/^https?:\/\//i.test(href))return inner;
return ''+inner+"";
}
return "<"+tag.toLowerCase()+">"+inner+"";
}
return Array.prototype.map.call(doc.body.childNodes,clean).join("");
}
function addBot(html,stacked){var r=document.createElement("div");r.className="proprofs_ai_chat__row";r.innerHTML='
'+(stacked?'':'')+'
'+linkify(html)+'
';scroll.appendChild(r);scrollToBottom();}
function addUser(t){var r=document.createElement("div");r.className="proprofs_ai_chat__row proprofs_ai_chat__row--user";var b=document.createElement("div");b.className="proprofs_ai_chat__user-bubble";b.textContent=t;r.appendChild(b);scroll.appendChild(r);scrollToBottom();}
function addCrisis(){var r=document.createElement("div");r.className="proprofs_ai_chat__row";r.innerHTML='
';scroll.appendChild(r);scrollToBottom();}
function typingOff(){var t=document.getElementById("proprofs_ai_chat_typing");if(t)t.remove();}
function typingOn(){typingOff();var r=document.createElement("div");r.className="proprofs_ai_chat__row";r.id="proprofs_ai_chat_typing";r.innerHTML='
';scroll.appendChild(r);scrollToBottom();}
function respond(text,questionType){
questionType=(questionType===1)?1:0;
startAiChatDurationTimer();
if(crisisLatch||hitsTripwire(text)){
crisisLatch=true;
addCrisis();
saveChatTurn(text,CRISIS.title+" "+CRISIS.body.replace(/<[^>]+>/g," "),true,questionType);
return;
}
busy=true;sendBtn.disabled=true;typingOn();
history.push({role:"user",content:text});
fetch(PROXY_URL,{
method:"POST",headers:{"Content-Type":"application/json"},
body:JSON.stringify({messages:history,articleTitle:ARTICLE_TITLE,artile_description:artile_description,coachName:"ProProfs Survey AI Coach"})
}).then(function(r){return r.json();}).then(function(data){
typingOff();
var reply=(data&&data.reply)?data.reply:"Sorry, something went wrong. Please try again.";
history.push({role:"assistant",content:reply});
saveChatTurn(text,reply,false,questionType);
var chunks=reply.split(/\n\s*\n/).map(function(c){return c.trim();}).filter(Boolean);
if(chunks.length===0){busy=false;sendBtn.disabled=false;return;}
var delay=0;
chunks.forEach(function(chunk,idx){
setTimeout(function(){
typingOff();
addBot(sanitizeHtml(chunk),idx>0);
if(idxYou could start with';
STARTERS.forEach(function(q){var b=document.createElement("button");b.className="proprofs_ai_chat__starter";b.textContent=q;b.addEventListener("click",function(){send(q,1);});st.appendChild(b);});
scroll.appendChild(st);
})();
How Do You Create a Data Quality Survey Using AI Survey Maker?
The single biggest mistake teams make is treating data quality as something you deal with after the survey closes. By then, the damage is already done.
The better approach is to design quality checks directly into the survey before it ever goes out, and this is exactly where AI Survey Maker earns its keep.
Here is how that actually works, step by step.
Step 1: Describe Your Survey Goal in Plain Language
Instead of staring at a blank template, you tell AI Survey Maker what you are trying to learn, for example, “measure how satisfied new customers are in their first 30 days.”
The tool builds a complete, logically ordered survey around that goal in seconds.
Try here:
Let ProProfs AI Build a Survey
Describe your survey and we'll create it for you
Already have a questionnaire draft, a research brief, or an old survey sitting in a document somewhere?
Upload it as a PDF, DOCX, or TXT file instead, and AI Survey Maker builds your survey directly from it, so you’re not starting from a blank page or retyping something that already exists.
This matters for data quality because a well-structured survey, with questions grouped by theme and built in a sensible order, is far less confusing for respondents than a random list of questions bolted together.
Confusion is one of the biggest hidden causes of bad data.
Step 2: Review the Question Flow and Add Skip Logic
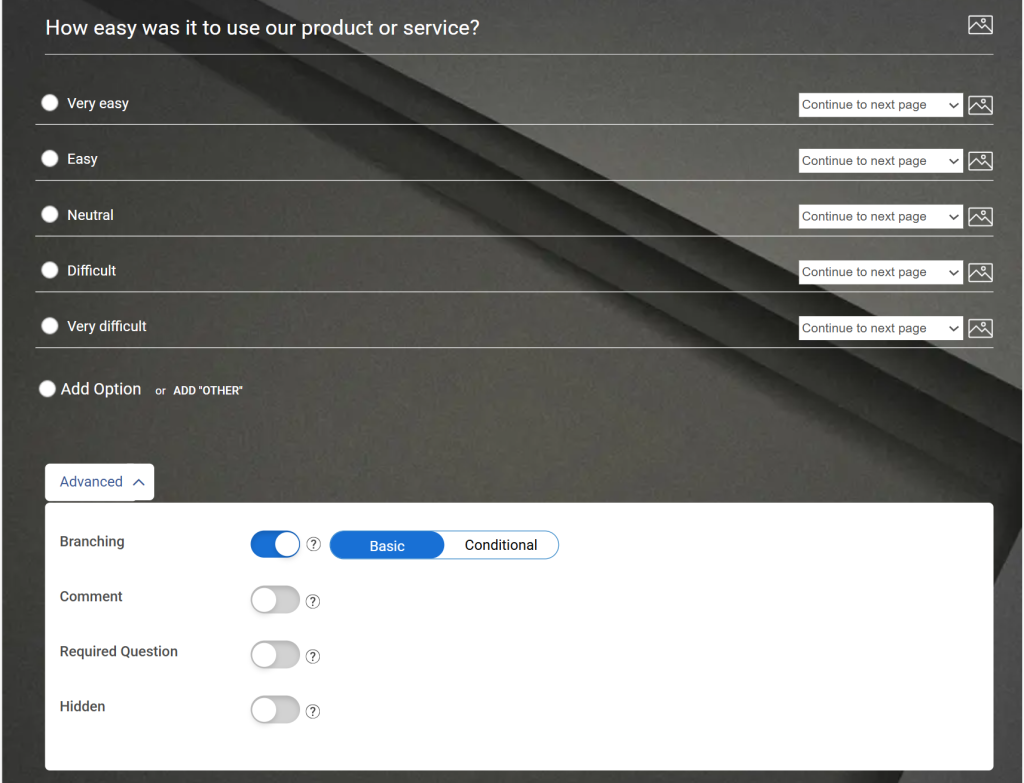
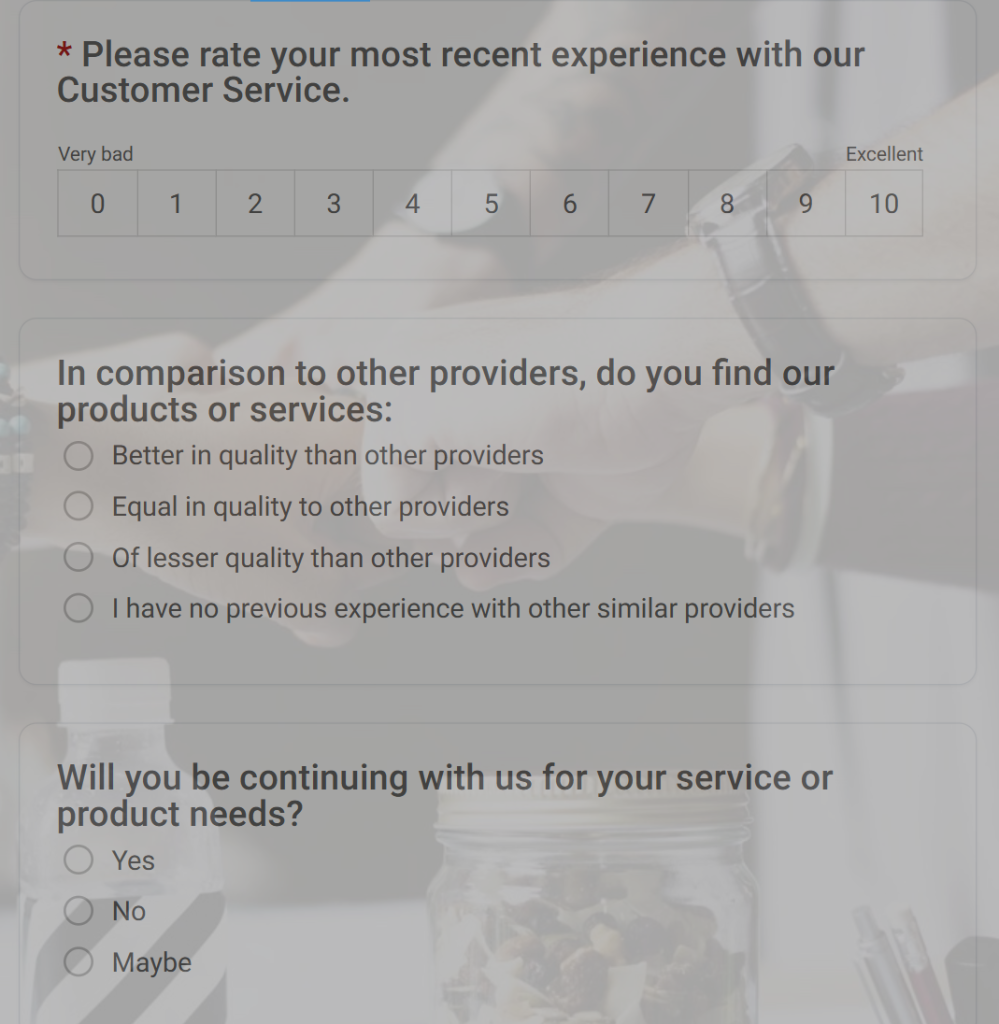
Once your draft survey is complete, review it and set up skip logic so respondents only see the questions relevant to them.
If someone says they have never used a feature, they should not be asked to rate it.
Forcing people to answer questions that do not apply to them is one of the fastest ways to get random, meaningless clicks.
Skip logic and branching in ProProfs Survey Maker route respondents automatically based on their earlier answers, so this happens without any extra manual work on your part.
Here’s how it works:
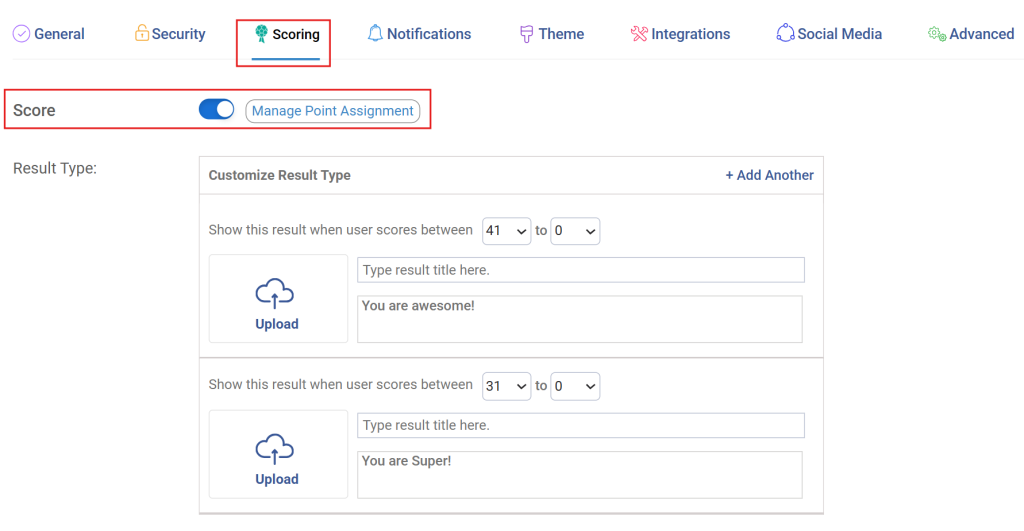
Step 3: Add a Scored Question Where It Fits
If your survey is doing more than collecting opinions, for example, qualifying leads or assessing skill level, add a scored question.
Scored surveys assign point values to specific answers and can route respondents to different outcomes or result pages based on their score.
This is useful for data quality because inconsistent or careless answers tend to produce scores that do not match the respondent’s other answers, which makes them easy to spot later.
Step 4: Place an Attention Check a Third of the Way Through
We cover the exact wording to use in the questions section below, but placement matters just as much as wording.
Add it after the survey has been generated, in the middle rather than the start or end, since that is where autopilot answering is most likely to happen.
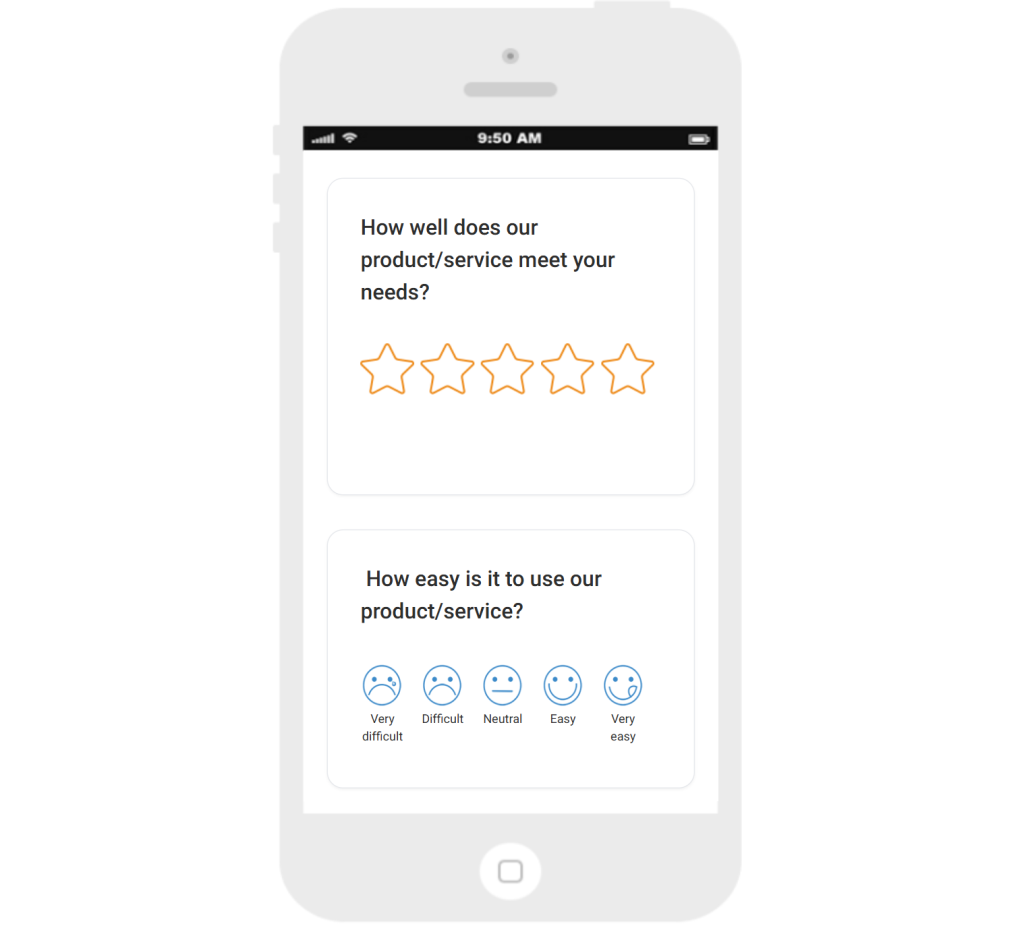
Step 5: Preview the Survey on Mobile Before Sending
A survey that looks fine on a desktop screen can be cramped and confusing on a phone, and confusing surveys lead to careless answers.
Since a large share of respondents will open your survey on their phone, this step is not optional.
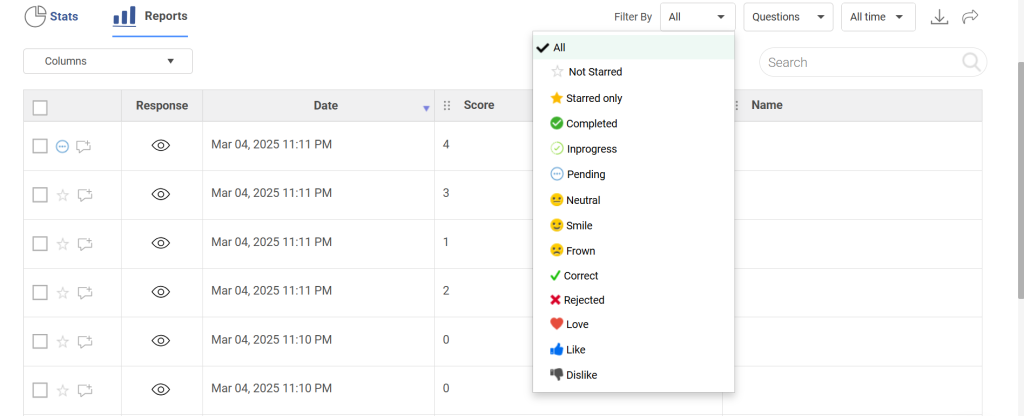
Step 6: Watch the Real-Time Dashboard After Launch
Rather than waiting until the survey closes to notice a problem, you can watch for warning signs early, like a sudden spike in unusually fast completions, and pause or adjust if something looks off.
The point of walking through this build process in detail is simple.
Every one of these steps takes a data quality problem that normally gets discovered during cleanup and prevents it during design instead. That is a much cheaper place to fix a problem.
What Data Quality Survey Questions Should You Ask?
You do not need a background in statistics to build quality checks into your survey. You need a small number of well-placed questions, each doing a specific job.
Below is a set you can copy directly, organized by what each one catches.
1. Attention Checks
These directly test whether the respondent is reading the question.
“To confirm you are reading each question carefully, please select ‘Strongly Disagree’ for this item.”
“This is a quality check question. Please select the second option from the top.”
2. Verification Pairs
These ask the same underlying question twice, worded differently, in two separate parts of the survey. If the answers contradict each other, the respondent was likely guessing on at least one of them.
Early in the survey: “How satisfied are you with our customer support?”
Later in the survey: “If a friend asked, how would you describe your experience getting help from our support team?”
These catch respondents who are answering questions about something they could not actually have experience with.
“In a typical month, how often do you use [product or feature]?”
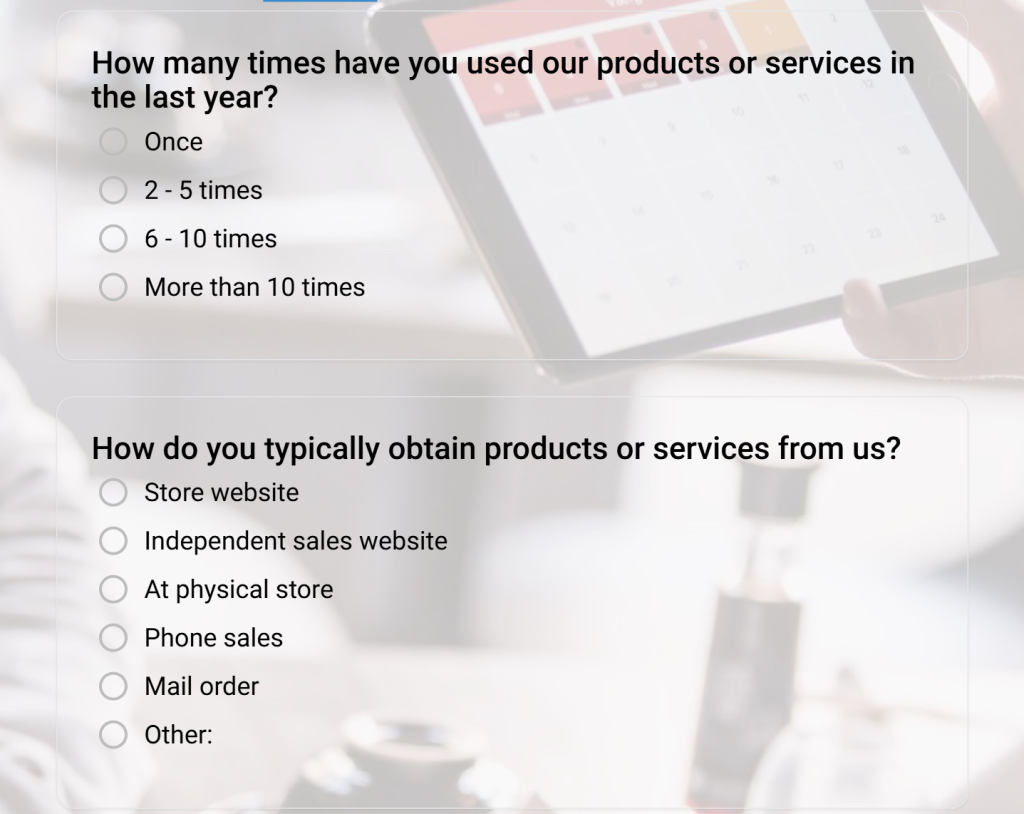
Anyone claiming daily use of a feature they should not have access to is worth a second look. Here’s a template you can use for a realistic scope check:
4. Self-Report Checks
This sounds almost too simple to work, but it catches more people than you would expect.
“Were you able to answer the previous questions carefully, or were you rushing through them?”
A surprising number of low-effort respondents will honestly admit to rushing when asked directly and neutrally.
5. Open-Ended Validators
A single short text question tied to an earlier closed question. A blank answer, or one that clearly does not relate to the topic, is a strong signal.
“You mentioned you were dissatisfied earlier. What is the one thing we could have done differently?”
Here is a quick reference for where each one belongs and why.
Question type
Best placement
What it catches
Attention Check
Roughly one-third of the survey
Random clicking, autopilot answering
Verification Pair
Split between early and late sections
Contradictory or guessed answers
Realistic Scope Check
Early, right after screening questions
Respondents who should not qualify
Self-Report Check
Near the end
Honest admissions of rushing
Open-Ended Validator
Immediately after a related closed question
Blank or irrelevant text answers
A word of caution here. Do not stack more than two of these into a single survey unless it is unusually long.
The goal is a light, well-placed net, not an interrogation. Overloading a short customer survey with five quality checks will hurt your response rate more than it helps your data.
Why Does Bad Survey Data Happen in the First Place?
Understanding why data quality problems occur makes every check in this guide easier to apply, because you start recognizing the pattern rather than just reacting to a strange-looking number.
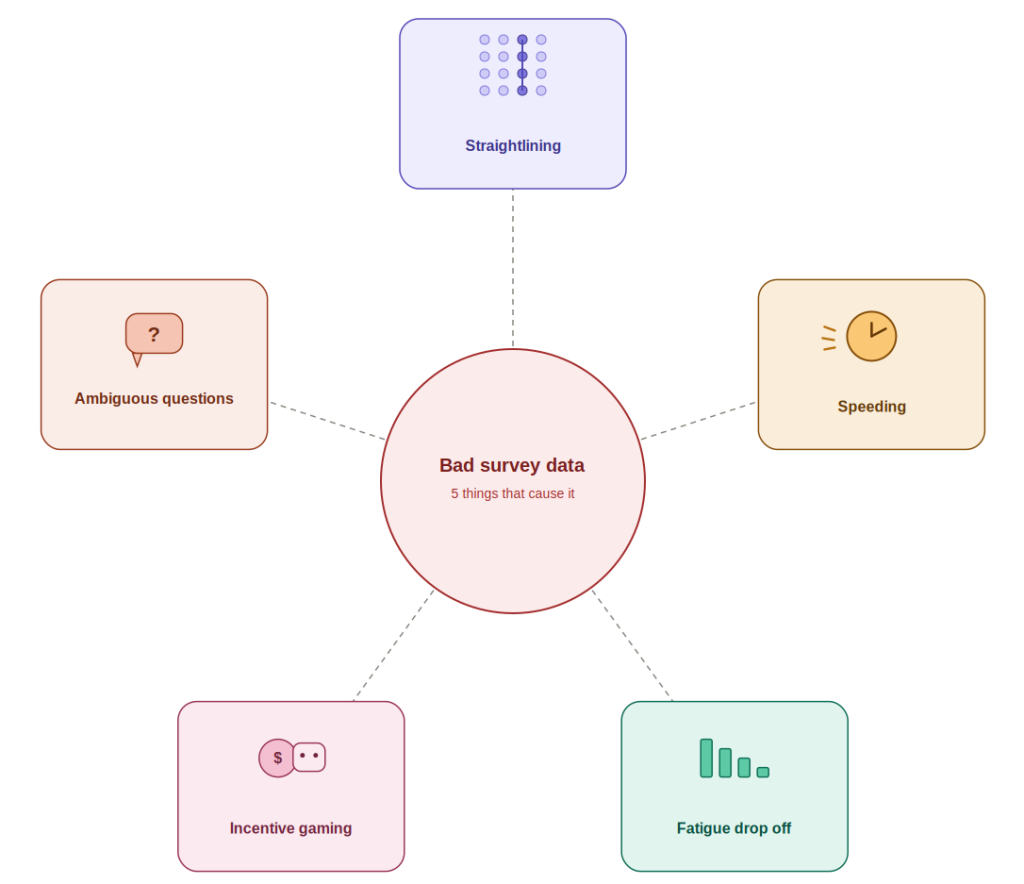
Most of it comes down to five recurring causes.
According to McKinsey’s 2024 survey, 82% of organizations spend at least one full day per week fixing master data issues, with 66% relying on manual reviews.
Here are the five causes explained:
Cause
What it looks like
Why it happens
Straightlining
A respondent selects the same rating across an entire grid of questions without reading them individually. The data looks complete, so it is easy to miss until every row says the exact same thing.
The grid format itself invites autopilot answering, especially when questions all use the same scale.
Speeding
A survey that should take ten minutes gets completed in ninety seconds.
Respondents, especially incentivized ones, are optimizing for finishing fast rather than answering thoughtfully.
Answers get noticeably more careless the longer the survey runs, typically past the fifteen to twenty question mark.
This is not a personal failing. It is a predictable attention pattern in almost any survey of meaningful length.
Incentive Gaming
Responses submitted purely to collect a reward, with no genuine opinion behind them.
Panel members, and increasingly bots, treat the survey as a transaction rather than a request for feedback.
Ambiguous Questions
What looks like a careless answer is actually a guess.
Poor wording forces respondents to guess, and a guess is indistinguishable from carelessness once it lands in your data.
Notice that four of these five causes are about survey design, not respondent behavior. That is good news, because it means most of this is within your control before the survey ever goes live.
FREE. All Features. FOREVER!
Try our Forever FREE account with all premium features!
What Survey Data Quality Checks Should You Run Before Trusting Your Results?
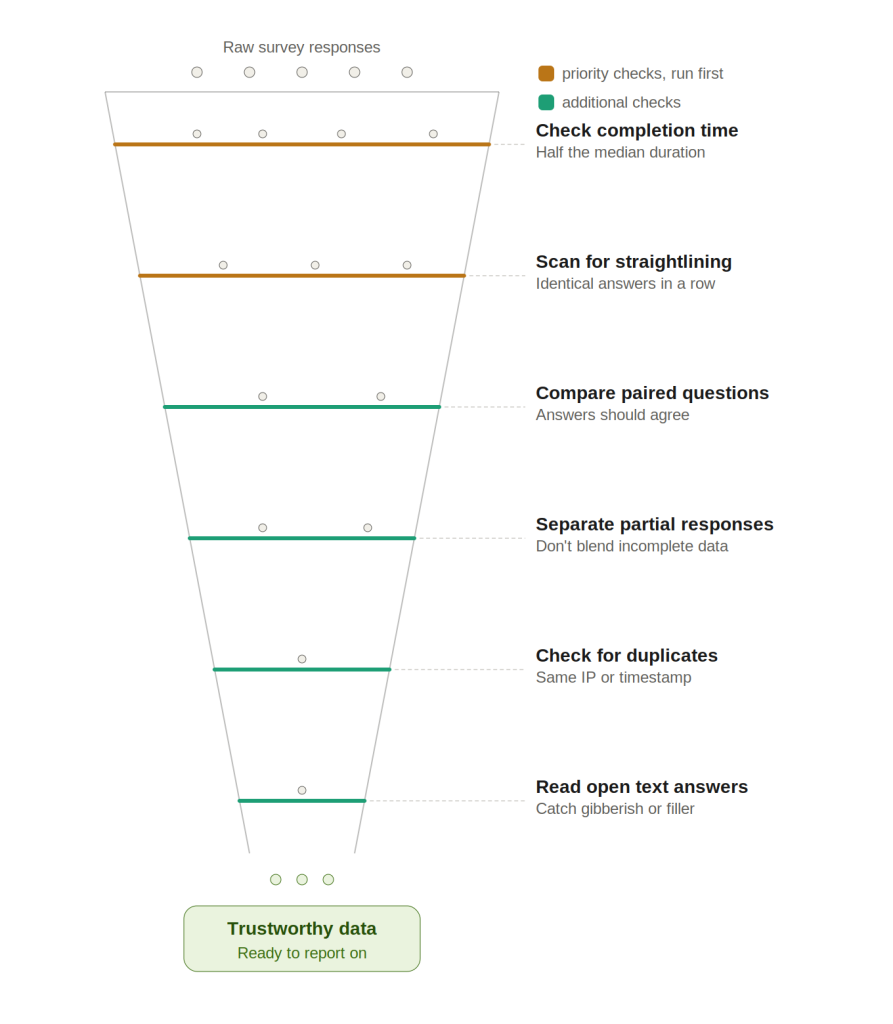
Once responses are in, run these checks before presenting the data to anyone or making a decision based on it.
Each one takes a few minutes, and none require specialized software.
1. Check Completion Time First
Review completion times and flag anyone who finishes in less than half the survey’s expected median time.
If your survey typically takes eight minutes, a response logged at ninety seconds deserves a second look before it counts.
2. Scan for Straightlining Patterns
Look through any rating grid and find rows where every answer is identical.
If you built a reverse-coded item into the grid, this becomes obvious right away, since a genuine straightliner will answer it the same way as everything else, which does not make logical sense.
3. Compare Consistency between Paired Questions
Check your verification pairs and any other paired questions that should logically agree.
A big gap between an overall satisfaction score and a specific related rating is worth investigating before you trust either number.
4. Separate Complete Responses from Partial Ones
Split partial submissions out from completed ones before you run any survey analysis. Partial data can still tell you something useful, but it should never be silently blended in with completed responses.
5. Look for Duplicate Submissions
Check for repeated IP addresses, near-identical timestamps, or matching open-text answers submitted under different respondent identities.
6. Read Open-Text Answers Closely
Go through free-text answers for gibberish, copy-pasted filler, or text that clearly does not relate to the question that was asked.
If you only have time for two of these, start with the completion time check and the straightlining check.
Together, they typically surface the largest share of low-quality responses in any given dataset, and both take just a few minutes to run manually.
How Can You Improve Survey Data Quality Without Adding Friction?
Better data quality does not mean a longer, more suspicious-feeling survey. It means making a few smarter choices at the design stage, and each one pulls its own weight.
Start with length. Every extra minute past the five to seven-minute mark increases the odds of fatigue-driven, careless answers. If your survey is running long, the fix is to cut questions, not to pile on more quality checks to compensate for a survey that is simply too long.
Skip logic does more work here than people expect. Showing respondents only the questions relevant to their situation removes a major source of confused, low-quality answers, since nobody is being asked to guess at something that does not apply to them in the first place.
Scored questions are worth using wherever they genuinely fit, particularly for assessments, discovery calls, or lead qualification. A respondent’s score naturally exposes inconsistent answers, because careless clicking tends to produce a score that does not match their other responses.
Reporting matters more than most teams give it credit for. If the person reviewing your results cannot easily read the dashboard, quality problems slip through unnoticed. A simple, visual report is closely reviewed. A dense, complicated one gets a quick glance and a rubber stamp, and that is exactly where bad data hides.
Finally, design for the audience you actually have. A survey aimed at busy customers or students needs a visual, mobile-friendly layout. A dense, form-like design built with a researcher in mind will not hold the attention of a general respondent, and attention is the entire game here.
None of this gets you to zero bad data. Nothing does. What it does is shift the odds heavily in your favor, so the checks above have less work to do.
How Do You Turn This Into a Repeatable Habit?
Here is the honest summary of everything above. Good survey data is not something you stumble into.
It is the result of a survey that was designed with a few specific safeguards in mind, checked with a short, repeatable process before anyone trusts the numbers, and reported in a way simple enough that problems do not get missed.
None of this requires a research department.
It requires a survey builder that lets you add skip logic and scored questions without extra engineering work, and a habit of running the same four or five checks every single time before you present results.
Build that habit once, and every survey after it gets a little more trustworthy by default.
Try ProProfs Survey Makerand build your next survey with AI Survey Maker, skip logic, and scored questions in place from the very first draft.
Or explore our guide to survey question types to see how question design directly affects the quality of your responses.
Frequently Asked Questions
What is the difference between survey data quality and response quality?
Response quality describes a single respondent's honesty and effort in one submission. Data quality describes the condition of your entire dataset once every response is combined, including duplicate removal, completion rates, and consistency across the full sample. A single dishonest answer is a response quality issue. A dataset full of rushed completions is a data quality issue. You need both to trust a final result.
How many responses do I need for reliable survey data?
It depends on your total population size and the confidence level you are aiming for, so there is no single universal number. That said, a small sample with clean, consistent answers is far more useful than a large sample padded with rushed or contradictory responses. Prioritize quality checks over chasing volume alone.
What is straightlining, and how do I catch it?
Straightlining occurs when a respondent selects the same answer across an entire grid of rating questions without actually reading the questions individually. You catch it by adding one reverse-coded item to the grid, since a genuine straightliner will answer it the same way as everything else, which does not logically hold up.
Do longer surveys hurt data quality?
Yes, generally they do. According to Dynata’s 2022 report, attention wanes, respondents speed up, provide shorter open-ended answers, and show more straight-lining or random responses later in the survey. Data quality suffers as interview length increases, with effects consistent over time.
Can incentives cause bad quality responses?
Yes. Reward-driven respondents, including bots and panel farmers, sometimes submit answers purely to collect a payout, with no genuine opinion behind them. This behavior tends to show up as unusually fast completions or identical answers across similar questions. Attention checks, time checks, and verification pairs catch most of it without needing to remove incentives altogether.
How do bots get into survey data, and how do I block them?
Bots typically submit responses at unusually fast speeds or in repeated, near-identical patterns from the same source, often with generic or copy-pasted open-text answers. A time check combined with a duplicate check, looking at IP addresses and timestamps, catches the large majority of automated or fraudulent submissions before they affect your results.
Does data privacy compliance affect survey data quality?
Indirectly, yes. Platforms with strong verification, security, and compliance controls tend to produce cleaner respondent pools with fewer duplicate or fraudulent entries from the start, since proper access controls make it harder for the same person or bot to submit multiple times. This matters most for panel-based or incentivized research, where fraud risk is already higher.
What is a good response rate for quality survey data?
There is no fixed benchmark, since it depends heavily on your audience, channel, and survey length. A modest response rate backed by strong completion and consistency checks is far more valuable than a high response rate padded with rushed, low-effort answers that would not hold up under review. When in doubt, prioritize the checks in this guide over chasing raw response volume.
Let ProProfs AI Build a Survey
Describe your survey and we'll create it for you
FREE. All Features. FOREVER!
Try our Forever FREE account with all premium features!
ProProfs Survey Maker Editorial Team is a passionate group of seasoned researchers and data management experts dedicated to delivering top-notch content. We stay ahead of the curve on trends, tackle technical hurdles, and provide practical tips to boost your business. With our commitment to quality and integrity, you can be confident you're getting the most reliable resources to enhance your survey creation and administration initiatives.




 We'd love your feedback!
 Thanks for your feedback!