ProProfs Survey Maker Editorial Team is a diverse group of professionals passionate about survey creation and market research. We update you on the latest trends, dive into technical topics, and offer insights to elevate your business.
You built a solid survey, sent it out, and now half your respondents are gone before question six. That gap between people who start and people who finish is exactly what survey dropout analysis is built to explain.
This isn’t the same problem as a low response rate. Response rate tells you how many people opened the survey.
Dropout rate tells you who left partway through, and dropout analysis tells you exactly where.
If you run employee engagement surveys, NPS programs, or customer research, that “where” is the difference between guessing why your data feels thin and knowing precisely which question to fix.
Tools like ProProfs Survey Maker build this breakdown into every report, so you’re not stitching drop-off numbers together from a raw export.
What Is Survey Dropout Analysis?
Survey dropout analysis is the process of measuring where, when, and why respondents leave a survey before completing it. It uses question-level drop-off percentages and time-on-question data to isolate which parts of a survey cause abandonment, so you can fix design issues instead of just reporting a completion percentage.
People often use response rate, completion rate, and dropout rate as if they’re interchangeable. They measure three different things, and mixing them up leads to fixing the wrong problem.
A marketing team that sees a low completion rate might assume their subject line failed and rewrite the invite email, when the actual issue is a confusing question at position four that has nothing to do with how the survey was distributed.
Metric
What It Measures
Why It Matters
Response Rate
Percentage of invited people who opened or started the survey
Tells you if your invitation, timing, and targeting are working
Completion Rate
Percentage of starters who finished every question
Tells you if the overall survey experience holds attention
Dropout Rate
Percentage of starters who left before the end, broken down by question
Tells you exactly where and, often, why people quit
If your response rate is healthy but your completion rate is low, the invitation isn’t the issue. The survey itself is.
This is the distinction most teams skip, and it’s the reason dropout analysis exists as its own discipline instead of being folded into general reporting.
ProProfs Survey AI Coach
Ask anything about surveys, feedback, and user insights
","text/html");
function clean(node){
if(node.nodeType===3){var t=node.textContent.replace(/\s+/g," ").trim();return t?t:"";}
if(node.nodeType!==1)return "";
var tag=node.tagName;
if(!allowed[tag])return Array.prototype.map.call(node.childNodes,clean).join("");
if(tag==="BR")return " ";
var inner=Array.prototype.map.call(node.childNodes,clean).join("");
if(tag==="A"){
var href=(node.getAttribute("href")||"").trim();
if(!/^https?:\/\//i.test(href))return inner;
return ''+inner+"";
}
return "<"+tag.toLowerCase()+">"+inner+"";
}
return Array.prototype.map.call(doc.body.childNodes,clean).join("");
}
function addBot(html,stacked){var r=document.createElement("div");r.className="proprofs_ai_chat__row";r.innerHTML='
'+(stacked?'':'')+'
'+linkify(html)+'
';scroll.appendChild(r);scrollToBottom();}
function addUser(t){var r=document.createElement("div");r.className="proprofs_ai_chat__row proprofs_ai_chat__row--user";var b=document.createElement("div");b.className="proprofs_ai_chat__user-bubble";b.textContent=t;r.appendChild(b);scroll.appendChild(r);scrollToBottom();}
function addCrisis(){var r=document.createElement("div");r.className="proprofs_ai_chat__row";r.innerHTML='
';scroll.appendChild(r);scrollToBottom();}
function typingOff(){var t=document.getElementById("proprofs_ai_chat_typing");if(t)t.remove();}
function typingOn(){typingOff();var r=document.createElement("div");r.className="proprofs_ai_chat__row";r.id="proprofs_ai_chat_typing";r.innerHTML='
';scroll.appendChild(r);scrollToBottom();}
function respond(text,questionType){
questionType=(questionType===1)?1:0;
startAiChatDurationTimer();
if(crisisLatch||hitsTripwire(text)){
crisisLatch=true;
addCrisis();
saveChatTurn(text,CRISIS.title+" "+CRISIS.body.replace(/<[^>]+>/g," "),true,questionType);
return;
}
busy=true;sendBtn.disabled=true;typingOn();
history.push({role:"user",content:text});
fetch(PROXY_URL,{
method:"POST",headers:{"Content-Type":"application/json"},
body:JSON.stringify({messages:history,articleTitle:ARTICLE_TITLE,artile_description:artile_description,coachName:"ProProfs Survey AI Coach"})
}).then(function(r){return r.json();}).then(function(data){
typingOff();
var reply=(data&&data.reply)?data.reply:"Sorry, something went wrong. Please try again.";
history.push({role:"assistant",content:reply});
saveChatTurn(text,reply,false,questionType);
var chunks=reply.split(/\n\s*\n/).map(function(c){return c.trim();}).filter(Boolean);
if(chunks.length===0){busy=false;sendBtn.disabled=false;return;}
var delay=0;
chunks.forEach(function(chunk,idx){
setTimeout(function(){
typingOff();
addBot(sanitizeHtml(chunk),idx>0);
if(idxYou could start with';
STARTERS.forEach(function(q){var b=document.createElement("button");b.className="proprofs_ai_chat__starter";b.textContent=q;b.addEventListener("click",function(){send(q,1);});st.appendChild(b);});
scroll.appendChild(st);
})();
What Are the Biggest Causes of Survey Dropout?
Here’s a short list of repeat offenders. Each one has a distinct fix, which is why lumping them together under “survey fatigue” doesn’t actually help you.
Length Mismatch Between the Invite and the Actual Survey
Surveys that run longer than the time stated in the invitation lose trust fast.
If you promise three minutes and the actual median completion time is seven, respondents feel misled partway through and abandon out of principle, not just fatigue.
The fix isn’t a shorter survey by default; it’s an accurate estimate based on your own completion data, not a guess made when the survey was built.
Each row technically counts as a decision, so five grids of six rows each is functionally a 30-question survey wearing a five-question costume.
Respondents feel the cumulative weight of every row, even though the survey looks short on paper.
Open-Ended Questions Placed Too Early
Open-text fields placed before question five ask for effort before the respondent has invested any time in completing the question.
Open text has the highest cognitive cost of any question type, and asking for it too early gives people an easy exit point before they’re committed to seeing the survey through.
Mobile Rendering Failures
Pages that require zooming or horizontal scrolling push respondents out of the question before it’s complete.
This shows up repeatedly, where users specifically flagged that surveys looked fine on desktop but broke down on phones, which is where a growing share of responses now originates.
Unexplained Sensitive Questions
Personal or sensitive questions with no context on why they’re being asked read as invasive rather than necessary.
Income, health, or identity questions dropped in without framing make respondents question the survey’s intent, and that hesitation often ends in an abandoned session rather than an honest answer.
Repetitive Scale Stacking
Multiple long dropdowns or rating scales presented back-to-back with no visual break or transition wear respondents down through monotony alone.
The repetition becomes the exit trigger, independent of how difficult any individual question actually is.
None of this happens in a vacuum. Microsoft’s 2025 Work Trend Index found that employees are interrupted roughly every two minutes during the workday, and 80% report not having enough time or energy to focus on their core work.
People are already running on fragmented attention before your survey link even reaches them.
Every extra second of friction, whether it’s a confusing grid or a page that won’t load properly on a phone, gives them a reason to close the tab and not come back.
How Do You Analyze Survey Dropout Step by Step?
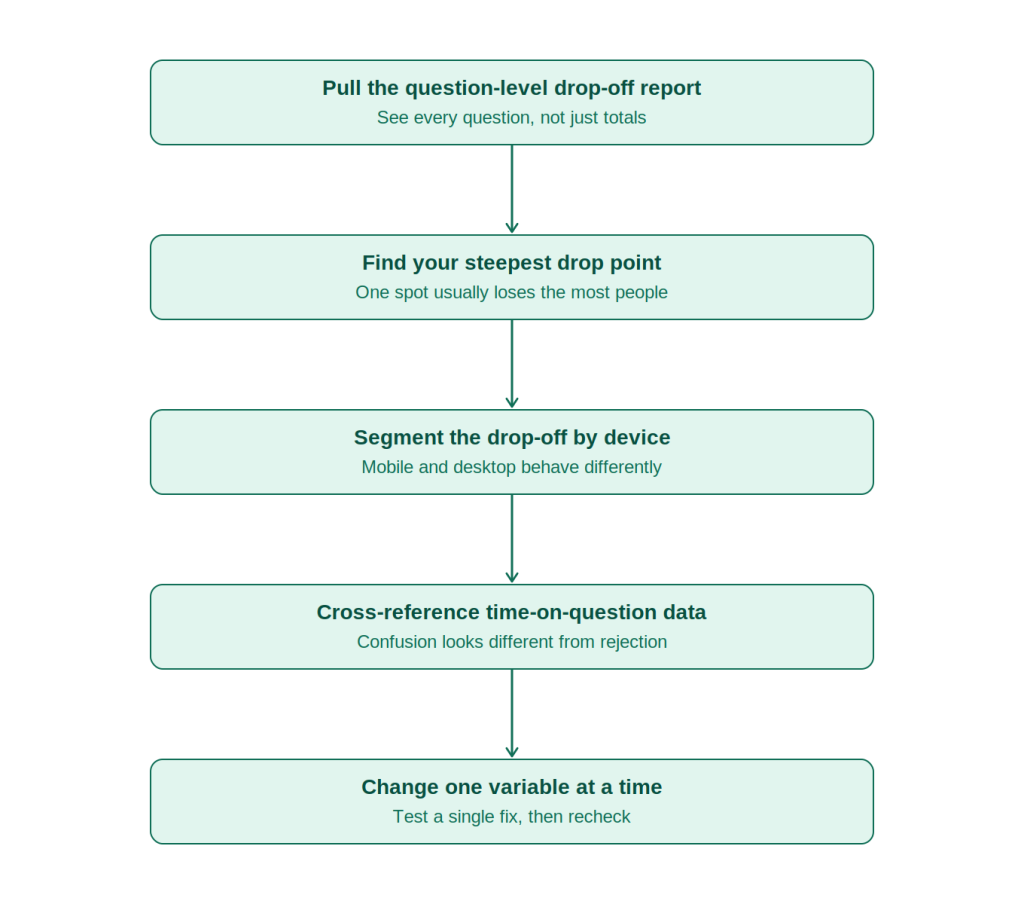
Dropout analysis isn’t a single report you glance at once. It’s a five-part sequence, and skipping steps is why most teams end up making changes that don’t move the number.
Pull the Question-Level Drop-Off Report
Start below the surface-level completion percentage.
A 68% completion rate tells you almost nothing on its own. What you need is the drop-off percentage at every single question in the flow, not just the start and end points.
Most platforms bury this a few clicks deeper than the main dashboard, which is exactly why it gets skipped. Export or view it question by question before drawing any conclusions.
Find Your Steepest Drop Point
Once you have the full question-level breakdown, look for the single largest jump between one question and the next.
Most surveys don’t lose people evenly. There’s usually one or two spots where the line on your drop-off chart falls off a cliff, and everywhere else the decline is gradual and expected.
Fix that one spot first. Smaller improvements elsewhere won’t move your overall number if the biggest leak stays wide open.
Segment the Drop-Off by Device
Pull the same question-level report again, this time split by mobile and desktop. A grid question that reads cleanly on a laptop screen can be functionally unreadable on a phone, with rows compressed and options overlapping.
If your dropout spikes specifically on mobile at one particular question, the fix is a design change for that question and that device, not a rewrite of the entire survey.
Cross-Reference Time-on-Question Data
Layer in how long respondents spent on each question before leaving or answering. A question with both a high drop rate and a long average time signals confusion or difficulty, meaning people are struggling to understand what’s being asked.
A question with a high drop rate but a short average time signals instant rejection, meaning people saw it and immediately decided to leave.
These require different fixes: the first needs clearer wording, the second needs to be moved, reframed, or removed.
Change One Variable at a Time
Once you’ve identified the likely cause, whether that’s a grid that’s too long, a question in the wrong position, or a mobile layout issue, change only that one variable before your next send.
If you rewrite the question, shorten the survey, and change the invite subject line all at once, you’ll fix the number without knowing which change actually did it, and you’ll have no repeatable process for the next survey.
What Should a Dropout Survey Questionnaire Include to Reduce Abandonment?
Each item targets a specific abandonment pattern identified in the causes section above, rather than offering a generic best practice.
State the number of questions and the estimated time to complete in the first line respondents see, and make sure that the estimate is accurate to your actual median completion time.
Put your easiest, lowest-effort question first, not your most important one. The first question sets the pace that the respondent expects for the rest of the survey.
Cap matrix or grid questions at five rows before switching to a different question type or splitting it into two shorter grids.
Replace at least one open text field with a multiple-choice plus an “other” option that includes a much shorter optional text box.
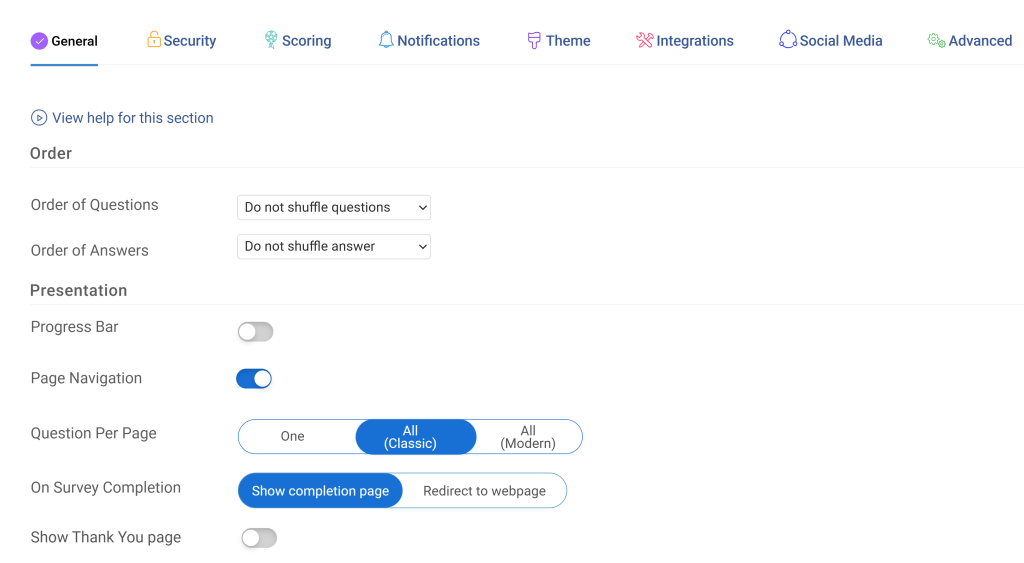
Add a visible progress indicator so respondents can see how much remains, reducing the uncertainty that drives mid-survey exits.
Place any sensitive or personal questions in the second half of the survey, after trust has been built, and add a one-line explanation of why it’s being asked.
FREE. All Features. FOREVER!
Try our Forever FREE account with all premium features!
How Do You Create a Survey Using ProProfs Survey Maker?
Once you know where your dropout problem lives, building a tighter survey shouldn’t take another afternoon.
1. Describe Your Goal to AI Survey Maker
Open AI Survey Maker and describe your survey goal in plain language, such as “a five-question post-onboarding survey for new hires.” Try it here:
Let ProProfs AI Build a Survey
Describe your survey and we'll create it for you
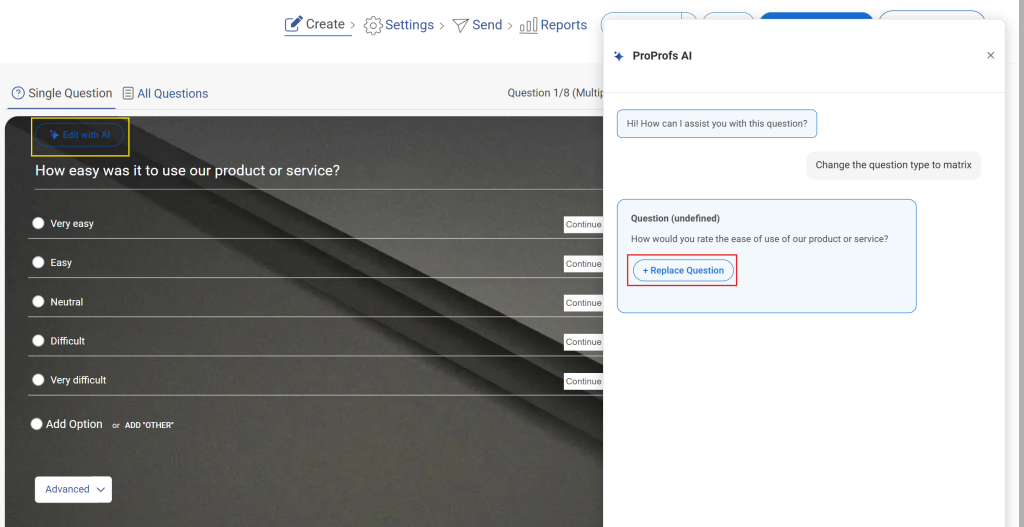
It generates a complete draft in seconds, built around your stated goal, so you’re editing an existing structure instead of staring at a blank page.
You can also upload a PDF, DOCX, or TXT file instead of typing a prompt, so an existing document, policy, or set of notes becomes the source material for your questions.
As you edit the draft, AI Survey Maker also suggests follow-up questions in real time, so refining the structure doesn’t mean starting from a blank page for each new question.
2. Choose or Adjust a Template
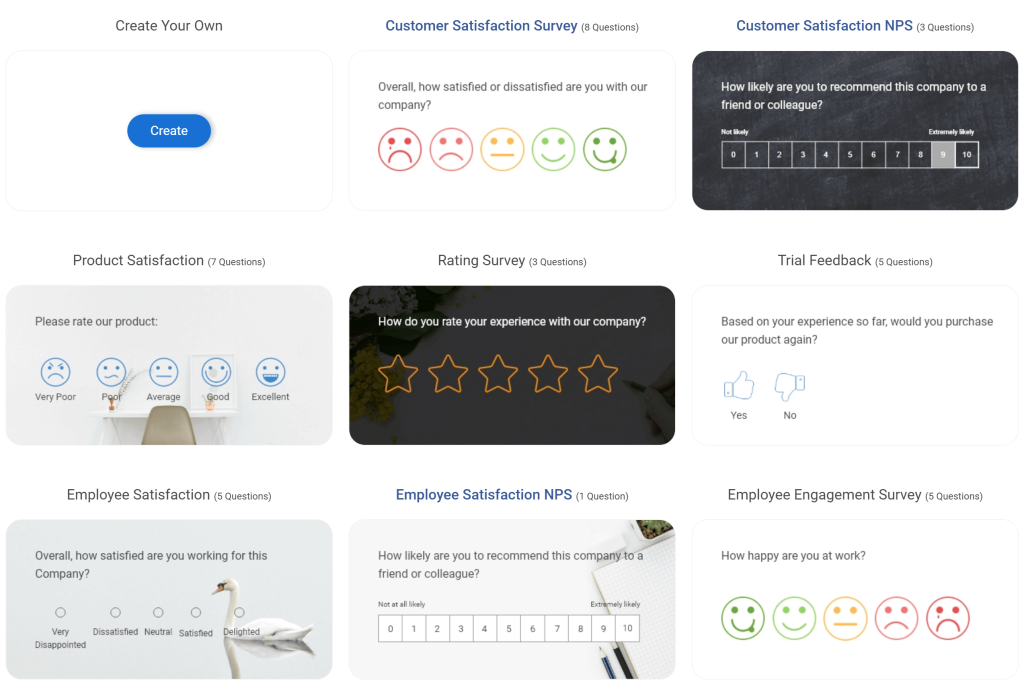
Select a template from the library that matches your use case, whether that’s NPS, CSAT, or an employee engagement pulse, or adjust the AI-generated draft directly.
This is the stage to apply what you learned from your dropout analysis: trim any question type that caused problems last time before it goes back out.
3. Add Skip Logic to Shorten the Path
Set up skip logic so respondents only see questions relevant to their previous answers. Here’s how it works:
A respondent who rates their experience positively doesn’t need the same follow-up questions as one who rates it poorly, and skip logic removes that irrelevant path automatically, cutting the effective survey length for most people.
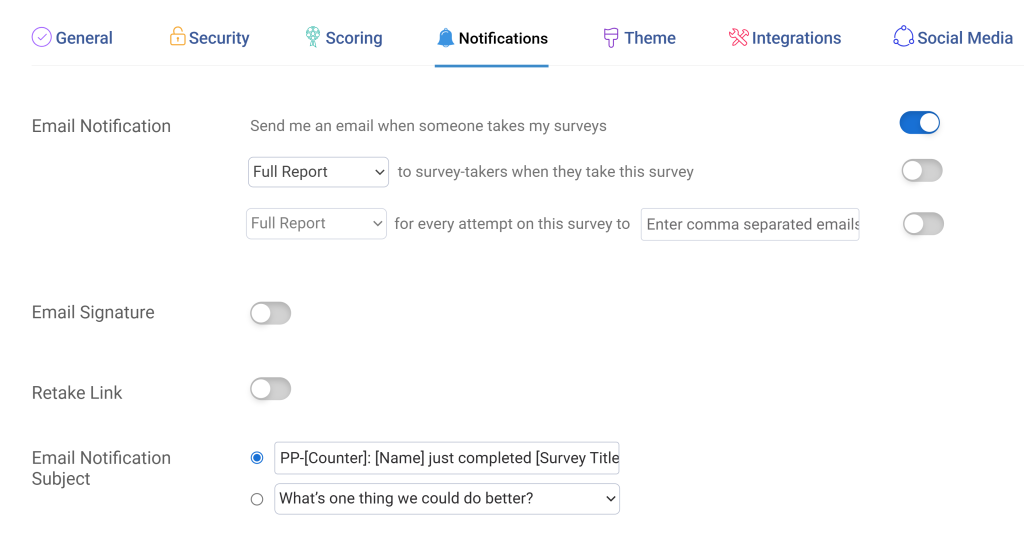
4. Turn on Completion Tracking Before You Publish
Enable response and completion tracking before the survey goes live, not after.
Dropout data only exists from the moment tracking is on, so turning it on late means losing visibility into your first batch of responses, which is often when design flaws are most visible.
5. Publish and Review the Dropout Report
Publish the survey and check the question-level dropout report after your first meaningful batch of responses, rather than waiting until the full campaign closes.
This lets you catch a bad question early and fix it mid-campaign instead of learning about it after every invitation has already gone out.
How Did College Hospital Cerritos Solve Its Compliance Survey Dropout Problem?
Compliance and training surveys are some of the hardest to get fully completed, since staff are often filling them out between shifts with limited time and little intrinsic motivation to finish every question.
College Hospital Cerritos ran into exactly this problem.
Staff surveys and training confirmations were going out regularly, but a steady share of submissions returned incomplete, so HR couldn’t confirm who had actually completed their required steps.
Every incomplete submission turned into a manual follow-up, and those follow-ups piled up faster than the team could clear them.
HR specialist Helena Romero’s team rebuilt the process using ProProfs Survey Maker.
They restructured the compliance surveys around shorter question sets, added a visible progress indicator so staff could see exactly how much remained, and enabled completion tracking that flagged incomplete responses as they occurred rather than at the end of a reporting cycle.
That last change mattered the most, since it meant HR could follow up on a gap the same week instead of discovering it a month later during a compliance audit.
The result was a shift to 100% compliance, achieved in a shorter time period than their previous process required, with manual chasing of partial responses removed from the workflow entirely.
What Is a Good Online Survey Dropout Rate Benchmark in 2026?
There isn’t a single number that applies across every survey type, and chasing one is part of why teams misread their own data.
A five-minute customer satisfaction survey and a twenty-minute employee engagement survey will never have comparable dropout profiles, and comparing them against the same external average tells you nothing useful about either one.
What you can benchmark reliably is your own trend over time.
Track your dropout rate by question after every send, and treat any new spike as a signal tied to a specific change you made, whether that’s a new question, a new distribution channel, or a longer survey than your last one.
This matters more because participation is declining broadly, not just on your own surveys.
Gallup’s State of the Global Workplace 2026 report found that global employee engagement fell to 20% in 2025, its lowest level since 2020 and the second consecutive year of decline.
Against that backdrop, holding steady against your own baseline is often a better outcome than hitting an external average that may not reflect your audience at all.
If your dropout rate stays flat while everyone else’s is climbing, that’s the more meaningful signal.
Turning Dropout Data Into a Better Survey
A dropout report is only useful once it changes what you build next.
The teams that actually lower their abandonment rate over time aren’t the ones with the lowest starting number.
They’re the ones who treat every send as a chance to test a specific fix against their own question-level data, rather than guessing at a redesign or copying an industry average that doesn’t match their audience.
Start with the single steepest drop point in your last survey, apply one change from the checklist above, and check the report again before you touch anything else.
That loop, repeated a few times, does more for your completion rate than any one-time overhaul.
You don’t need a paid plan to test any of this: ProProfs Survey Maker’s free plan covers up to 50 responses, enough to run a full dropout-analysis cycle on your next survey before deciding whether to upgrade.
Ready to see exactly where your next survey loses people? Try ProProfs Survey Maker and check your first dropout report before your next send.
Frequently Asked Questions
Why does online survey dropout rate matter for your data?
A high dropout rate skews your sample toward only the most patient or most extreme respondents, hiding the moderate middle. Gallup's State of the Global Workplace 2026 report found global engagement fell to 20% in 2025, its lowest since 2020, so a high-dropout engagement survey measures an even smaller, more filtered slice of an already disengaged workforce.
What is the difference between the survey dropout rate and the survey response rate?
Response rate measures the percentage of people who were invited to your survey and responded. The dropout rate measures how many of those starters left before finishing, broken down by question. A survey can have a strong response rate and still lose most of its value due to a high dropout rate.
How many questions are too many before dropout increases?
There's no fixed number that applies to every audience, but abandonment typically climbs once a survey moves past 15 to 20 questions or runs longer than the time stated in the invite. Skip logic reduces this by showing each respondent only what applies to them.
Does mobile design affect survey dropout rate?
Yes. Grid questions, long dropdowns, and pages that require zooming or horizontal scrolling cause noticeably higher dropout on phones than on desktop. Segmenting your question-level dropout report by device is the fastest way to confirm this, since a grid that reads cleanly on a laptop can become unreadable once rows compress on a smaller screen.
What is a normal dropout rate for an employee engagement survey?
It varies widely by organization size, survey length, and how much trust employees have that feedback leads to action. A twenty-minute engagement survey will never match the dropout profile of a five-minute customer survey, so comparing either one against an external average tells you little. Compare each cycle against your own prior cycle instead to spot real changes.
Can skip logic reduce survey dropout?
Yes. Skip logic shortens the path for each respondent by hiding irrelevant questions based on earlier answers, so someone who rates an experience positively never sees the same follow-up questions as someone who rates it poorly. Shorter, more relevant paths are one of the most reliable ways to reduce mid-survey abandonment.
Why do people drop off in the middle of an NPS survey?
The most common cause is an open-ended follow-up question appearing immediately after the score, without any context on why it's being asked. Open text carries the highest cognitive cost of any question type, so asking for it too early gives people an easy exit point. Framing the follow-up as optional or offering multiple-choice reasons first usually reduces the drop.
How do you calculate survey dropout rate?
Divide the number of respondents who started but didn't finish by the total number who started, then multiply by 100. For question-level analysis, calculate this same ratio at each individual question rather than just at the survey level, so you can see exactly where the drop happens instead of only how much.
Should you follow up with people who dropped out of a survey?
It depends on the survey type. For short, low-stakes surveys, it's usually not worth the effort. For longer research or engagement surveys, a brief reminder mentioning the time remaining can recover a meaningful share of partial responses, especially if it's sent while the survey is still fresh in their mind.
Let ProProfs AI Build a Survey
Describe your survey and we'll create it for you
FREE. All Features. FOREVER!
Try our Forever FREE account with all premium features!
ProProfs Survey Maker Editorial Team is a passionate group of seasoned researchers and data management experts dedicated to delivering top-notch content. We stay ahead of the curve on trends, tackle technical hurdles, and provide practical tips to boost your business. With our commitment to quality and integrity, you can be confident you're getting the most reliable resources to enhance your survey creation and administration initiatives.





 We'd love your feedback!
 Thanks for your feedback!