Customer retention is the percentage of customers who continue buying from you after their first purchase, measured over a set period. A high retention rate means your product delivers on its promise. A low one means something in the experience, onboarding, or support is quietly pushing customers out before they see the full value.
New customers are coming in, revenue looks busy, but growth still feels flat. If that sounds familiar, the problem usually is not acquisition. It is the leak on the other side.
Most businesses spend the majority of their marketing budget on bringing people in and almost nothing on keeping them.
The result: a revolving door that works against you at every growth stage.
In this guide,
- Get a clear, practical method to measure your current customer retention/churn.
- Use a structured framework to identify why customers are leaving
- Learn 20 actionable strategies to reduce churn and improve retention
- Implement a simple feedback system to continuously gather insights
- Leverage tools like ProProfs Survey Maker to do all this without needing a full analytics team
Let’s get into it.
What Are the Most Effective Customer Retention Strategies?
The strategies below are grouped by theme. Each covers a different point of leverage in the customer lifecycle. You do not need to run all of them at once. Start with the theme that maps to where your customers are most likely to leave.
1. How Does Onboarding Affect Customer Retention?
The first session a customer has with your product predicts more about long-term retention than any follow-up campaign you will ever run.
If they do not reach a meaningful result within the first 10 minutes, engagement drops sharply and rarely recovers.
The mistake most teams make: treating onboarding as a feature tour.
“Here is the dashboard. Here is the settings menu. Here is the reporting panel.”
That is not onboarding. That is a product demo the customer already sat through. Real onboarding is designed around one clear first win, something specific and achievable that proves the product does what it promised.
Two Principles That Drive Better Onboarding Outcomes:
- Progressive Activation: Hide advanced features until the basics are mastered. It reduces cognitive overload and keeps the customer focused on the value path.
- The 30-Day Signal Check: A 50% drop in login activity over two weeks is a reliable early warning, often appearing 60 to 180 days before an actual cancellation. If you are not watching for it, you will miss the window to intervene.
2. How Can Customer Feedback Help Reduce Churn?
Customers who see their feedback acted on renew at higher rates. The feedback loop is not a listening exercise. It is a retention mechanism with a measurable return.
The problem is not that teams do not ask. Most either ask at the wrong moment or do nothing visible with the results. Both feel the same to the customer: indifference.
Ask at These Three Moments:
| Touchpoint | Goal |
|---|---|
| Post-onboarding | Did the first experience deliver on the promise? |
| 30-day mark | Is the customer still engaged and finding value? |
| 60 days before renewal | Would they recommend you, and if not, why? |
When you receive a low score, treat it as a re-engagement opportunity, not a data point to file away. Reach out. Tell the customer what you heard, what you are fixing, and follow up when it is done. This single move converts detractors into advocates more reliably than any loyalty program.
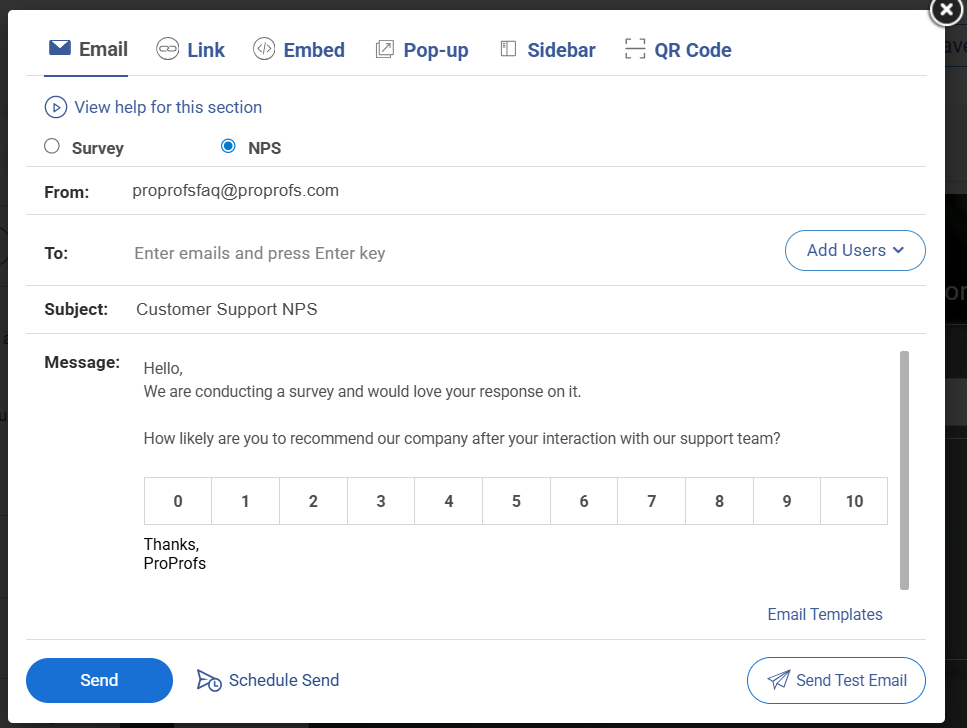
ProProfs Survey Maker includes pre-built NPS, CSAT, and pulse survey templates for each of these touchpoints, with automated distribution so the right survey reaches the right customer at the right moment, without anyone on your team having to remember to send it.
3. How Can Better Customer Service Improve Retention?
Service is one of the fastest ways to lose a customer, and one of the fastest ways to earn their loyalty back.
A 2025 PWC research indicates that 52% of customers are willing to leave a brand over a single bad service experience. And in a 2022 HubSpot survey, 90% rate an “immediate” response as very important when they have a question.
Here is what better service actually looks like in practice:
- Respond Fast: Every extra hour a customer waits is a quiet nudge toward looking at alternatives. Live chat is now a baseline expectation, not a premium feature.
- Personalize the Interaction: Use purchase history, account data, and past survey responses to make the conversation feel like it is about them, not a ticket number.
- Over-Deliver on Commitments: Promise a response within 24 hours; respond within 8. Promise delivery in five days, ship in three. The gap between what you promise and what you deliver is where trust is built or lost.
- Train Your Team on the Product, Not Just the Script: Customers can tell within two exchanges whether the person helping them actually understands the product.
4. What Role Do Loyalty Programs Play in Client Retention Strategies?
A loyalty program does not need to be a complex point system with a branded app. The core principle is simple: reward the behavior you want to see more of, usually repeat purchase or sustained usage frequency.
What Works and What Does Not:
| Approach | Why It Works or Does Not |
|---|---|
| Tiered reward structures | Gives customers a goal to work toward. A customer two purchases away from the next tier is not thinking about switching. |
| Flat discounts | One-time incentive with no anchor. Once redeemed, the loyalty signal disappears. |
| The Ben Franklin Effect | Ask for a small favor: join an advisory group, beta test a feature. Customers who contribute tend to root for the product. |
| Online community | The more embedded your product is in a customer's peer group, the harder it is to replace. |
Driving internal expansion, getting your product into more seats within the same organization, is one of the highest-leverage retention moves available.
5. What Are the Best Retention Operations to Put in Place?
Tactics without infrastructure do not scale. These are the operational moves that make everything else work consistently:
| Tactic | What It Does | When to Set It Up |
|---|---|---|
| Automated re-engagement trigger | Sends outreach when usage drops below a threshold | During onboarding setup |
| Account health audit | Flags underutilized accounts before they churn | Quarterly |
| Subscription or recurring model | Shifts focus from transaction value to relationship value | When the product supports it |
| Commission clawback policy | Aligns sales incentives with retention outcomes | If misaligned expectations drive early churn |
| Employee engagement investment | Engaged teams deliver better customer experience | Ongoing |
The commission clawback point deserves attention. A significant share of churn is a “day zero” problem. The customer was sold something that did not match reality.
When sales reps face no consequence for over-promising, they keep doing it. Clawbacks for customers who churn within 6 to 12 months change that calculation quickly.
6. How Does Transparency Build Long-Term Customer Loyalty?
Customers do not expect perfection. They expect honesty.
When something goes wrong, businesses that communicate proactively keep more customers than those that go quiet and hope nobody notices.
Three Transparency Moves That Work:
- Tell customers about delays before they have to ask. Silence during a problem reads as indifference.
- Publish a visible changelog that ties updates back to customer feedback. When customers see their input showing up in product decisions, it builds the kind of trust that survives a competitor’s pitch.
- For education, healthcare, and non-profit buyers specifically, visible alignment with their values matters. These buyers are not just purchasing a product. They are deciding which vendors reflect who they are.
How Do You Measure Customer Retention Rate?
Before you can improve retention, you need a number. Here is the formula:
CRR = ((Customers at End of Period – New Customers Acquired) / Customers at Start of Period) x 100
Quick example: You start with 1,000 customers. 400 churn. You acquire 200 new ones. You end with 800.
CRR = ((800 – 200) / 1,000) x 100 = 60%
A 60% monthly retention rate is low for most businesses.
| Industry | Healthy Annual Retention | Average Annual Churn |
|---|---|---|
| SaaS (SMB) | 85% to 90% | 10% to 15% |
| SaaS (Enterprise) | 90% to 95% | 5% to 10% |
| E-commerce / Retail | 63% | 37% |
| Professional Services | 84% | 16% |
| Media / Subscription | 84% | 16% |
Source: Statista, Bain & Company, PwC (2025–2026 industry benchmarks)
CRR alone does not tell the full story. Track these alongside it:
| Metric | What It Tells You | When to Measure |
|---|---|---|
| Churn Rate | Percentage of customers lost in a period | Monthly |
| Customer Lifetime Value (CLV) | Total revenue per customer before they leave | Quarterly |
| Net Promoter Score (NPS) | How likely customers are to recommend you | Post-onboarding, 6-month, annual |
| Customer Effort Score (CES) | How easy it is to get an issue resolved | After every support interaction |
| Repeat Purchase Rate | How often do customers return to buy | Monthly |
| Product Embeddedness | Active integrations or team seats in use | Quarterly |
CES is the most underused metric in this list. Research from Gartner shows that reducing customer effort is a stronger predictor of renewal than satisfaction scores alone. The easier you make it to get help, the more likely customers are to stay.
What Are the Most Common Reasons Customers Churn?
If you are going to improve customer retention, you need to know which version of the problem you are dealing with.
| Churn Reason | Warning Signal | Where to Start |
|---|---|---|
| Perceived Overpaying for Unused Features | Low feature usage, billing-related tickets | Proactive account audit, right-size the plan |
| Hit a Feature or Response Limit | Requests for workarounds, complaints about caps | Roadmap visibility, upgrade conversation |
| Poor Onboarding, No Early Win | Low engagement in the first 30 days | Redesign the first session around one result |
| Slow or Frustrating Support | Negative CSAT scores, unresolved follow-ups | Cut resolution time, add a CES survey post-ticket |
| Silent Churn | Login frequency drops 50% over two weeks | Automated 30-day check-in |
| Sales Set Unrealistic Expectations | Early complaints about missing features | Sales-to-success handoff, realistic demo process |
| Competitor Switch | Comparison questions in support chat or surveys | Feature parity audit, targeted retention offer |
For education, healthcare, and non-profit customers, the most common driver is the first row. They are not leaving because the product is bad. They are leaving because they feel like they are paying for a version of it they will never use.
The fix is not a discount. It is a proactive conversation about what they actually need, ideally before renewal comes up.
How Can You Build a Retention Strategy That Works?
Most retention advice is a list of tactics. Lists do not create lasting client retention. Systems do.
Here is the framework that turns everything above into a repeatable cycle.
The Feedback-to-Action System
- Collect. Run NPS, CSAT, or pulse surveys at three moments: post-onboarding, the 30-day mark, and the renewal window. These are the three highest-risk moments in any customer lifecycle.
- Analyze. Segment responses by tenure, plan tier, and usage level. A complaint from 40% of customers approaching renewal is a different priority than the same complaint from 5% of new signups.
- Prioritize. Focus on patterns showing up repeatedly from the customers most likely to leave. Not every piece of feedback needs immediate action.
- Implement. Assign a named owner and a deadline to every prioritized issue. Feedback without ownership is just a spreadsheet.
- Monitor. Re-survey the same segment 60 to 90 days after the fix ships. If the metric did not move, the fix did not land.
Then close the loop visibly. Tell customers what changed because of their input.
This one step increases re-survey participation, deepens trust, and makes customers significantly harder to poach.
Running this cycle manually across multiple accounts is where most teams break down. ProProfs Survey Maker automates distribution at each touchpoint, segments responses by customer attributes, and surfaces patterns in the reporting dashboard without requiring an analyst to pull the data.
FREE. All Features. FOREVER!
Try our Forever FREE account with all premium features!
How Can You Use ProProfs Survey Maker to Run a Retention System?
Most teams know they should be collecting feedback at the right moments. They do not do it consistently because building surveys, distributing them on schedule, and digging through results takes time they do not have.
Here is how to set it up so the system runs without you.
Step 1: Set Your Goal
Before you open the tool, decide what you are measuring and at which touchpoint. Pick one:
- Post-onboarding: Did the customer get their first meaningful result?
- 30-day pulse: Are they still engaged and finding value?
- Pre-renewal NPS: Would they recommend you, and if not, why?
One goal per survey. Combining touchpoints in a single survey dilutes everything.
Step 2: Let AI Generate the Questions
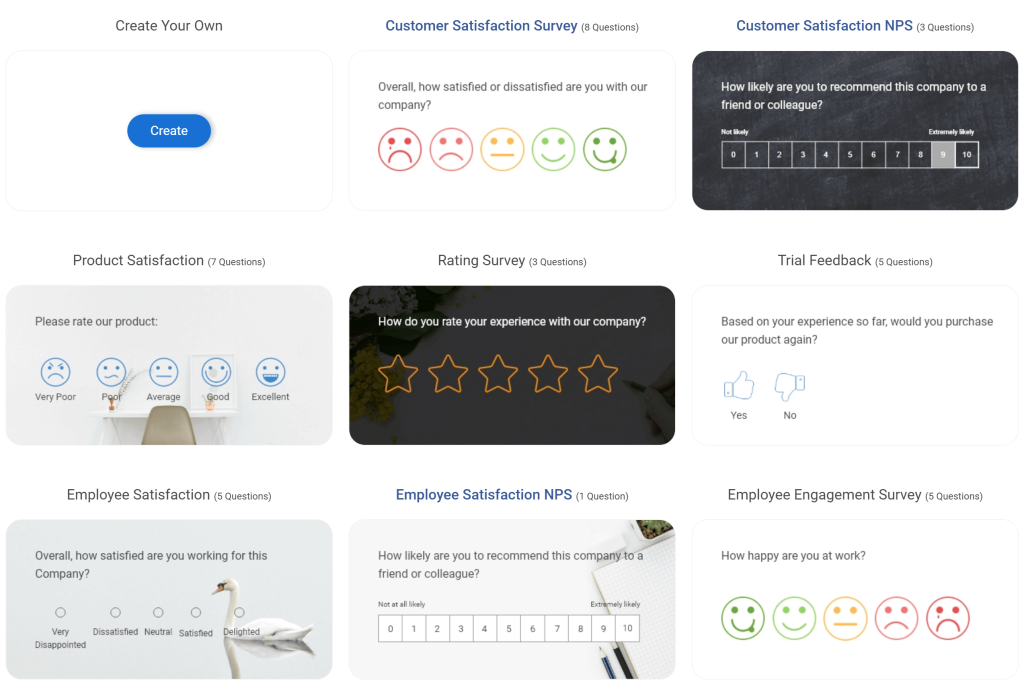
Enter your goal into Survey Maker’s AI survey generator.
The AI produces a draft with the right question types, logical order, and a question count suited to the touchpoint:
- 30-day pulse survey: typically five to seven questions
- Pre-renewal NPS: typically three to five questions
The AI matches the question type to the goal, not just the topic. You are not starting from a blank page or a generic template.

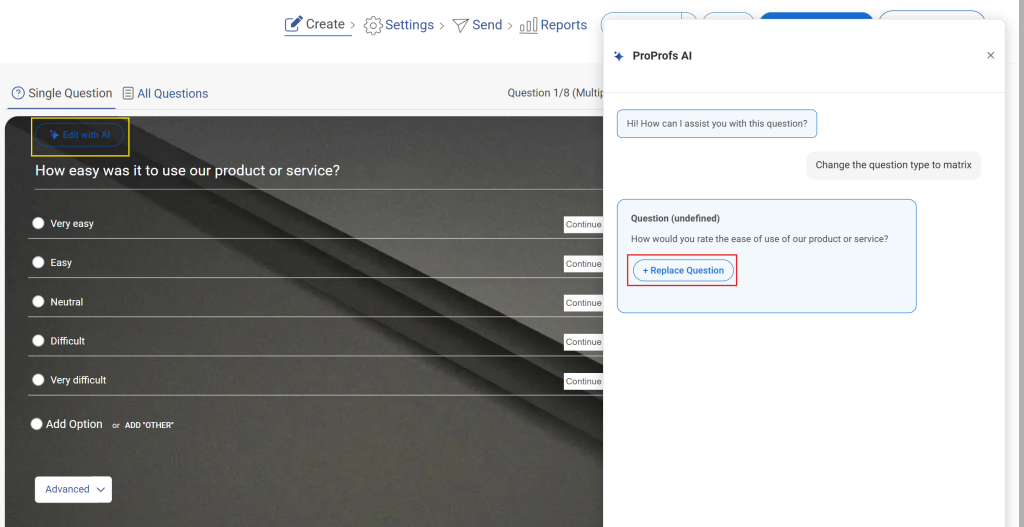
Step 3: Edit and Customize
Review the AI draft against your specific customer context.
- Adjust phrasing to match your brand’s tone.
- Add one product-specific question if there is a feature you want to measure directly.
- Remove any question where the answer would not change what you do next.
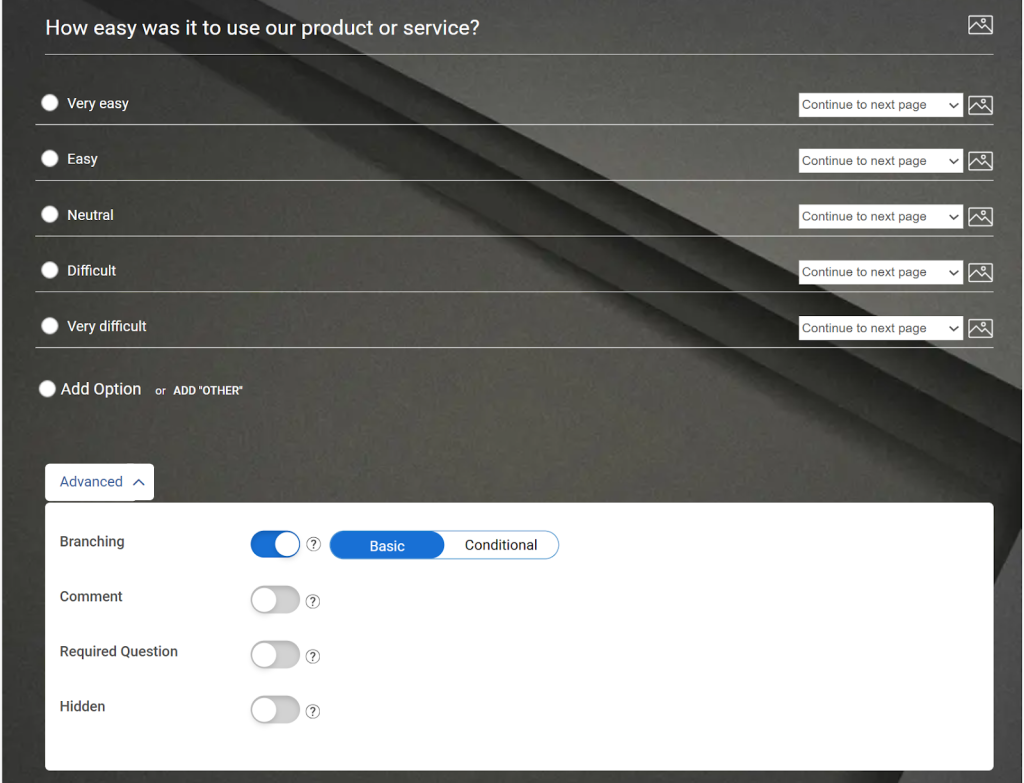
Turn on logic branching for NPS surveys.
If a customer scores below 7, the next question should automatically ask what specifically went wrong, not a generic open-ended prompt. That specificity is what makes the data actionable.
Step 4: Set Distribution
Choose how the survey reaches customers:
- Email distribution on a set schedule
- In-product embed
- Shareable link
- Triggered send based on a date or event, such as 30 days after signup
For retention surveys, triggered sends outperform manual scheduling every time. Set the trigger once during setup, and it runs automatically across every new customer.
Step 5: Launch and Track Results
Once live, responses populate in real time in the reporting dashboard.
What the dashboard shows:
- Overall NPS or CSAT score
- Response rate
- Open-ended answer themes
- Score trends over time
Here’s a quick video tutorial for you:
For retention purposes, the trend line matters more than the absolute score. A score that drops 10 points between the 30-day and 90-day surveys is an early warning signal, regardless of where it started.
When a customer scores below 7 on NPS, Survey Maker triggers an automated alert to the assigned customer success rep to follow up within 24 hours. That is the system closing the loop on its own.
Ready to Stop the Leak and Start Keeping the Customers You Earn?
Acquisition fills the funnel. Retention determines whether any of it sticks.
Every strategy in this guide works. But none of them work without one thing: knowing what your customers are actually experiencing before they quietly decide to leave. That requires a feedback system, not a one-time survey.
Start small. Pick one touchpoint, post-onboarding is the highest-leverage place to begin. Set up one survey on ProProfs Survey Maker, automate the send, and let the first week of responses show you more about your retention problem than six months of churn reports ever could.
The businesses that retain the best are not the ones with the most tactics. They are the ones with the clearest signal on what their customers need, and the system to act on it before it is too late.
Frequently Asked Questions
What is a good customer retention rate?
It depends on your industry. SaaS businesses aim for 85 to 95% annually. E-commerce typically sees 55 to 75%. If your rate falls below the benchmark for your sector, start by diagnosing churn reasons before changing tactics.
What is the difference between churn rate and retention rate?
They are the inverse of each other. If your monthly retention rate is 85%, your churn rate is 15%. Retention tells you who stayed. Churn tells you who left. Both matter because they behave differently as leading and lagging indicators.
How does customer lifetime value relate to retention?
CLV is the total revenue a customer generates before they stop buying. Improving retention extends the relationship and multiplies CLV without increasing acquisition spend. A 5% retention improvement can grow profits by 25 to 95%, according to Bain and Company research.
What is silent churn, and how do you prevent it?
Silent churn is when a customer stops using your product without officially canceling, typically 60 to 180 days before formal cancellation. Monitor for login frequency drops of 50% or more over a two-week window and trigger automated outreach at that signal point.
How do you build a customer loyalty program that works?
Tie rewards directly to the behavior you want more of, usually repeat purchase or sustained usage. Tiered structures work better than flat discounts because they give customers a goal to work toward rather than a one-time incentive to redeem and forget.
Does employee satisfaction affect customer retention?
Yes, directly. Engaged employees deliver faster and more personalized service. Research consistently shows a correlation between employee NPS and customer NPS within the same organization. Investing in employee engagement is a customer retention decision, not just an HR one.
How do social media and online communities improve user retention?
Customers active in a brand community have higher product embeddedness and lower churn rates. Responding quickly to public mentions and forum questions signals responsiveness and keeps customers from building their case for switching in a public forum.
What metrics should you track to measure how to improve customer retention?
Track CRR, churn rate, CLV, NPS, CES, and repeat purchase rate together. No single metric tells the full story. CES is especially underused: the easier it is for a customer to get help, the more likely they are to renew.
FREE. All Features. FOREVER!
Try our Forever FREE account with all premium features!
 We'd love your feedback!
What did you like & how can we make it even better?

 Thanks for your feedback!
 Ask Your Question
Have a question? Get expert help to make your decision easier.