


‘Quantitative data’ can be understood as something that can be counted and measured. It is a simple concept that offers insight into the number of required variables.
As a business, you have been using qualitative data for different purposes. Think of the time when you wished to know how many repeat customers you have or what percentage of customers buy items with a value exceeding $1000.
Quantitative research can allow you to study a wider audience, get rich insights, and make data-backed decisions in a manner of minutes. So if you are still wondering “what is quantitative data” and wish to explore its various attributes, collection methods, advantages, or types, this blog is for you.
But before we dive into deep waters, let us first start with the quantitative data definition.
What is Quantitative Data?
Quantitative data refers to data that can be expressed in numerical terms. Answers to questions like ‘How much’, ‘How many’, ‘What percentage’, and ‘How often’ are what constitutes quantitative data. Such data cannot be used for statistical analysis. However, you must try and identify relevant groups and descriptions to make sense of the data.
Create a quantitative survey now
Quantitative Data Types with Examples
There are two main types of quantitative data. They are:
- Discrete
- Continuous
In simple terms, Discrete data is countable and Continuous data is measurable. Let’s explore the two types of data in detail.
Discrete data is data that can be expressed in specific values. These values are typically counted in whole numbers and cannot be broken down into smaller units. Discrete data is also known as attribute data. Thus, you can easily identify discrete quantitative data by questioning whether the given data can be counted or not. This type of data is usually represented using tally charts, bar charts, and pie charts.
A few examples of discrete data include:
- Number of members in a team
- Number of toffees in a packet
- Number of questions in a test paper
- Monthly profit of a business
- Shoe size number
On the other hand, continuous data is data that can take any value. This value has a tendency to fluctuate over time. Thus, the value will vary over a given period of time, depending on when you seek the data. This type of quantitative data is usually represented using a line graph as a line graph aptly illustrates the data changes occurring over a period of time.
Continuous data can be further divided into two types, namely, ratio data and interval data. Statistically, the geometric or harmonic mean is calculated in ratio data while the arithmetic mean is calculated in interval data.
A few examples of continuous data include:
- The daily temperature of a place
- Height of a baby
- Weight of a child
- Wind speed
- Length of a leaf
Quantitative Data Collection Methods
You can collect quantitative data in many different ways. Let’s have a look at a few of them.
1. Probability Sampling
Probability sampling is a great way to eliminate sampling bias. It allows you to reach out to your target population and collect data in the most effective way possible with a representative sample.
Additionally, you can opt for any of the following sampling techniques as per your convenience and requirement.
- Simple random sampling – In this, each member of the targeted population has an equal probability of being selected for sampling.
- Systematic random sampling – In this, each member of the population is selected from a preset or ordered sampling frame. For example, you select the first target member for sampling randomly and then select the rest in a predetermined fashion thereafter, say every third member of the group or say, every fifth member of the population.
- Stratified random sampling -In this method, you divide the population into smaller sub-groups called strata. These strata are made using a common attribute that defines that set of people, for example, income or occupation.
2. Questionnaires and Surveys
This is a great way to collect quantitative data as it involves quick and to-the-point questions and answers. It comprises surveys, checklists, and ratings. You must have often come across surveys asking you about how many times you buy a certain product or service. These surveys are commonly used to understand customer value and monitor their dependency on the product or service.
- Web-based questionnaires often come in the form of a survey link in your mail and include some close-ended questions that aim to collect information about a specific topic. These surveys can be created using secure online survey tools that are easy to collect and can be accessed anywhere and anytime.
- Mail questionnaires are sent out to the targeted population with a cover sheet that enlightens the audience about the topic. It allows the researcher to connect with a vast number of people, giving them time to get acquainted with the topic and respond to the questionnaire at their convenience. The researcher may also offer an incentive to people for responding to the mail with the complete survey.
3. Interviews
For interviews, the researcher asks a standard set of questions to the interviewee. The interview may be telephonic or face-to-face. In this, the interviewer prepares a set of questions and puts these in front of the interviewee to answer. The face-to-face is often the most preferred method of interviewing as it is more interactive and allows the interviewer to build rapport. The researcher can also extract insight into answers by observing the body language of the interviewee, etc.
4. Open Source Datasets
In the age of the internet, getting information on any topic is no more a hassle. Whether you’re seeking information on finance, communication, dentistry, commerce, or the internet itself, there’s an overflow of information that you can access 24×7. You can easily access free and reliable information from a wide range of open datasets online.
5. Experiments
This data collection method involves making some changes to variables and then observing their effect on other variables. For this, you need to be vigilant and be prepared to fail as the success of this method is secured only after trials and errors. Thus, here, the researcher primarily aims to understand the cause and effect relationship of a specific situation.
Quantitative Data Analysis Methods
If you’re still looking for an answer to how to analyze quantitative data, we’re here to help. Analyzing quantitative data is easy, provided you collect the right quantitative research data and incorporate the right technique to analyze that data.
Here, we will look at a few quantitative data analysis methods that you can choose to analyze your next data research project effectively.
1. Cross-Tabulation
This method utilizes a basic tabular format to draw inferences between the collected data. It involves gathering multiple variables and understanding the correlation between them. This method is also known as contingency table or cross tabs and is apt for extracting relevant information from large data sets
2. MaxDiff Analysis
MaxDiff analysis, also called the ‘best-worst’ method, aims to gauge the preferences of the respondents. So whether you need to know which purchase was more fulfilling for the customer or what parameters the customer ranks more, this method is excellent to adopt in such a scenario.
3. TURF Analysis
TURF, an acronym for Total Unduplicated Reach and Frequency Analysis, aims to determine the market strategy for a business. It involves analyzing which platform offers the maximum reach so that you can direct your team efforts in the right direction
4. Gap Analysis
A gap analysis simply aims to identify gaps in attaining the desired results. It helps identify gaps and bottlenecks, paving the way for improved data and ultimately, better business performance.
5. SWOT Analysis
A SWOT analysis helps upi identify the various strengths, weaknesses, opportunities, and threats of a product, service, or organization. It helps you visualize the bigger picture and identify which areas need improvement and which areas can be leveraged to improve overall performance.
6. Text Analysis
Text analysis is apt for transforming and making sense of unstructured data. This process helps you extract valuable information from a large dataset, easing data collection and improving decision making.
FREE. All Features. FOREVER!
Try our Forever FREE account with all premium features!
Steps to Conduct Quantitative Data Analysis
Now that you have become familiar with quantitative data definition along with data collection and analysis methods, here is how you can conduct quantitative data analysis in 5 simple steps.
- Validating Data – The first step to conducting data analysis is to validate your data. Is the data relevant? Is it free of personal bias? These are common questions that you must ask yourself before you set out to analyze the data.
- Data Cleaning – Now, once the data has been validated for accuracy and bias, you must edit the data for consistency and relevancy. For instance, a respondent may have omitted to answer all questions. This is a case for incomplete data that will not give the required details for complete data analysis.
- Analyze the Data – Now is when you sit down to analyze the data. Look for descriptive statistics such as Mean, Median, and Percentage and establish a common pattern of evaluation.
- Interpret the Results – In this stage, you transform the data so that it can be easily understood by key stakeholders. Determine a measurement scale and decide how you are going to represent the collected data.
Quantitative Data Examples
Identifying quantitative data is simple as there is a numerical value assigned to the data. Let’s look at a few quantitative data examples in order to grasp a better understanding of it.
- I grew by 2 inches this year.
- The 43 children attended the event last night.
- He lost 20 pounds after the training.
- We have availed 12 holidays this year.
- The smartphone costs $1500.
- About 34% of people prefer staying in on weekends.
- The jar holds 10 gallons of water.
- The room is 30 feet in width.
In all of the above examples, there is a numerical value in each data.
Advantages of Quantitative Data
The main advantages of quantitative data are:
- For Extensive Research – Statistical analysis comes easy with quantitative data. Such data offer a detailed and better understanding of the subject matter, allowing you to gain insight into the pertaining numerical pattern for further research.
- Remove Personal Bias – Personal preferences influence the quality of respondents’ information. It impacts the interpretation of data received. In the case of quantitative data, which is concrete, it eliminates any scope for personal bias, lending credibility to the data.
- Precise Outcome – Quantifying the data provides specific, accurate, and reliable results. This data is free from incomplete descriptions, offering information that is easy to analyze and interpret.
- Summarises Data – Summarized data in the form of quantitative data helps interpret the data quickly, saving both time and effort. Thus, such data helps in extracting relevant and crisp information from a well-analyzed set of data effortlessly.
Disadvantages of Quantitative Data
Everything has its pros and cons. Similarly, quantitative data too has its own share of disadvantages. Let’s look at them below.
- Inadequate Data – Since data is only in quantifiable terms, it is possible to omit the descriptive aspect of the final result.
- Misleading Results – Results of assessing quantitative data such as questionnaires and surveys can be misleading as there is a risk of bias creeping in due to prejudiced assumptions.
FREE. All Features. FOREVER!
Try our Forever FREE account with all premium features!
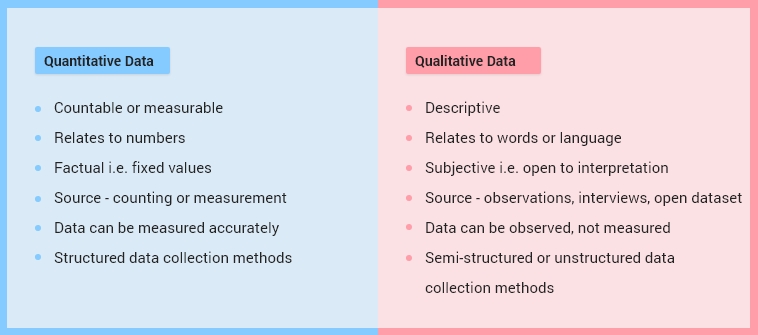
Difference Between Quantitative Data and Qualitative Data
We can understand the difference between quantitative and qualitative data clearly with the below table:
Ensure Precision with Solid Quantitative Data Collection
Data collection is an integral part of any research project. While you may find a particular data collection method convenient to use, the overall gist of collecting data to extract specific, relevant information will remain the same.
Quantitative data collection offers you data in numerical terms, making it easier for you to support or reject an assumption and arrive at a conclusion. With proven quantitative data collection methods such as surveys, questionnaires, probability sampling, interviews, and experiments, you can get the most relevant answers that help move your research forward.
Now that you are familiar with everything that encapsulates the collection and analysis of quantitative data, you can enhance the overall data collection and analysis efficiency with a secure and collaborative research solution – ProProfs Survey Maker. Choose from hundreds of ready-to-use and professionally designed templates to get started with your next survey. You can even create survey, forms, tests, and quizzes and share these with your respondents as a link, via social media, or even embed them on your website.
FREE. All Features. FOREVER!
Try our Forever FREE account with all premium features!
 We'd love your feedback!
What did you like & how can we make it even better?

 Thanks for your feedback!
 Ask Your Question
Have a question? Get expert help to make your decision easier.