Customer satisfaction metrics are quantitative indicators that measure how well your products, services, and support experiences meet customer expectations.
The most widely used are NPS, CSAT, and CES, each of which answers a different business question.
Most companies collect at least some satisfaction data. Very few use it in a way that actually changes how they operate.
The problem is rarely a lack of data. It is picking the wrong metrics, collecting scores without context, and failing to close the loop with the customers who flagged issues.
This guide covers the 10 most important customer satisfaction metrics, how to calculate each, and the business decision each metric is meant to inform.
Whether you are building your first measurement program or trying to make your existing surveys more actionable, here is exactly what you need to know.
What Are Customer Satisfaction Metrics?
Customer satisfaction metrics are standardized measurement systems used to capture how customers perceive their experience with a brand at both the relationship level (overall loyalty) and the transactional level (specific interactions). The most widely used are NPS, CSAT, and CES, each measuring a different dimension of the experience.
Without these metrics, satisfaction stays a feeling. With them, it becomes a decision-making tool.
You can identify which touchpoints are losing customers, which support interactions are creating friction, and which accounts are quietly at risk before they churn.
The key distinction most teams miss: satisfaction metrics are not a report card. They are an early warning system.
A dropping NPS score three months before renewal is a retention opportunity. A rising ticket volume after a product update is a signal to act before CSAT scores fall.
The teams that treat metrics this way retain more customers than those that review scores quarterly and then move on.
Types of Metrics to Measure Customer Satisfaction
Customer satisfaction metrics fall into two broad categories.
Relationship Metrics measure how customers feel about your brand overall, across the entire history of their experience with you. Net Promoter Score is the clearest example.
Transactional Metrics measure how customers feel about a specific interaction, like a support ticket, a purchase, or an onboarding call. CSAT and CES are the primary transactional metrics.
Most companies need at least one of each.
A high relationship score with low transactional scores tells you customers love your brand but are struggling with specific processes.
The inverse tells you individual interactions are going well, but something about the overall experience is eroding trust.
10 Best Customer Satisfaction Metrics to Track
Here is a quick orientation before we go deeper:
| Metric | What It Measures | Best Used At |
| NPS | Long-term loyalty and brand advocacy | Quarterly or post-onboarding |
| CSAT | Satisfaction with a specific interaction | Immediately after support, purchase, or delivery |
| CES | Ease of completing a task with your company | After support tickets or onboarding steps |
| Customer Churn Rate | Percentage of customers lost in a period | Monthly or quarterly review |
| CLV | Total revenue value of a customer relationship | Strategic planning and CAC decisions |
| Customer Health Score | Early warning system for at-risk accounts | Ongoing for SaaS and subscription businesses |
| First Contact Resolution | Whether issues are resolved in the first interaction | Support team performance reviews |
| First Response Time | How fast your team acknowledges a request | Daily or weekly support operations |
| Ticket Volume | Volume of incoming support requests over time | Capacity planning and product issue detection |
| Customer Acquisition Cost | Cost to acquire one new customer | Budget and marketing ROI planning |
Here’s the detailed breakdown:
1. Net Promoter Score (NPS)
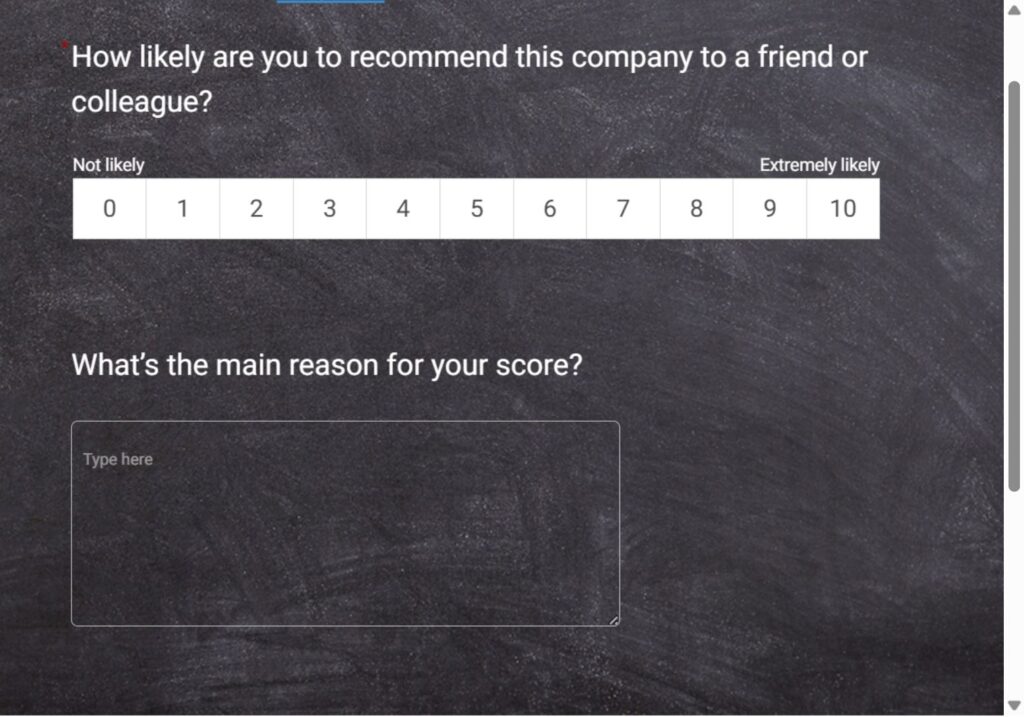
Net Promoter Score measures the likelihood that customers will recommend your company to a friend or colleague. It is the most widely used relationship-level satisfaction metric across B2B and B2C businesses.
NPS is a loyalty metric based on a single question: “How likely are you to recommend us to a friend or colleague?”
Responses on a 0-10 scale sort customers into three groups: Detractors (0-6), Passives (7-8), and Promoters (9-10).
How to Calculate NPS:
NPS = % Promoters – % Detractors
If 150 out of 300 respondents are Promoters (50%) and 60 are Detractors (20%), your NPS is 30.
Scores range from -100 to +100. An NPS above 0 is positive, above 50 is excellent, and above 70 is considered world-class. For context, Tesla maintains an NPS of 96, while Amazon sits around 54.
Here’s a quick video you can watch to calculate NPS:
When to Send an NPS Survey:
- 30 to 90 days after onboarding
- Quarterly for existing customers
- After major product updates or renewals
Getting NPS surveys out at the right moment is where most teams lose consistency. Sending manually after every onboarding call does not scale.
ProProfs Survey Maker lets you schedule NPS surveys automatically, triggered 30, 60, or 90 days after onboarding or at renewal, so the right customer gets the right survey without anyone on your team having to remember to send it.
Here’s an NPS template you can use:
What to Do With the Score:
Follow up with detractors directly and personally. Ask one open-ended question: “What would need to change for you to rate us higher?” That response is where your actual roadmap lives.
NPS is most powerful when tracked over time, not as a one-time snapshot. What matters is whether the score is trending up or down and why.
Pros: Benchmarkable across industries. Proven link to revenue growth. Single question drives high response rates.
Cons: Does not capture what specifically needs fixing. Sample size matters. Scores vary by industry, making cross-industry comparisons misleading.
2. Customer Satisfaction Score (CSAT)
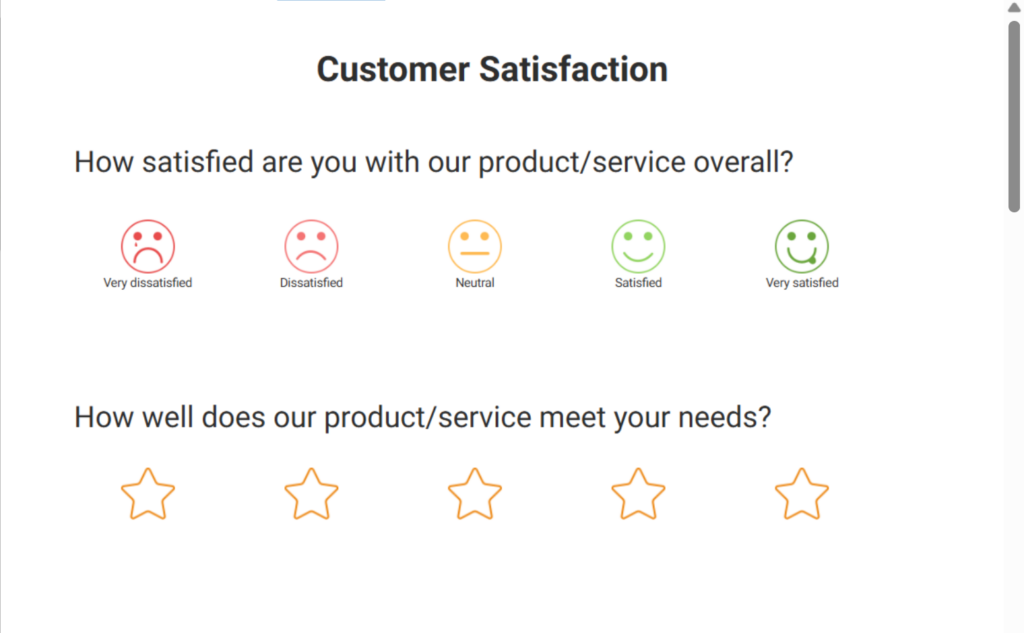
CSAT measures how satisfied a customer is with a specific interaction, product, or support experience. It is the most direct way to get a snapshot of how a recent touchpoint landed.
CSAT is a transactional metric, typically a 1-to-5 or 1-to-10 rating question sent immediately after an interaction.
It tells you how customers felt at that moment, not about your brand overall.
A Ready-to-Use Csat Question Set for Support Teams:
- “How satisfied were you with your experience today?” (1 = Very Unsatisfied, 5 = Very Satisfied)
- “Was your issue resolved?” (Yes / No)
- “Is there anything we could have done better?” (Open text)
Here’s a CSAT survey template you can use:
How to Calculate CSAT:
Divide the number of respondents who scored 4 or 5 by the total number of respondents, then multiply by 100.
Example: 3 out of 8 respondents rated 4 or 5, giving a CSAT of 37.5%.
Industry CSAT benchmarks from the American Customer Satisfaction Index (2024):
- Banks: 80
- Full-service restaurants: 84
- Airlines: 77
- Social media platforms: 74
When to Send a CSAT Survey:
- Immediately after a support interaction closes
- After a product delivery or installation
- Following an onboarding call
Pros: Fast to collect. High response rates. Easy to benchmark against industry standards.
Cons: Captures only short-term sentiment. Unhappy customers often skip surveys entirely, skewing scores upward.
3. Customer Effort Score (CES)
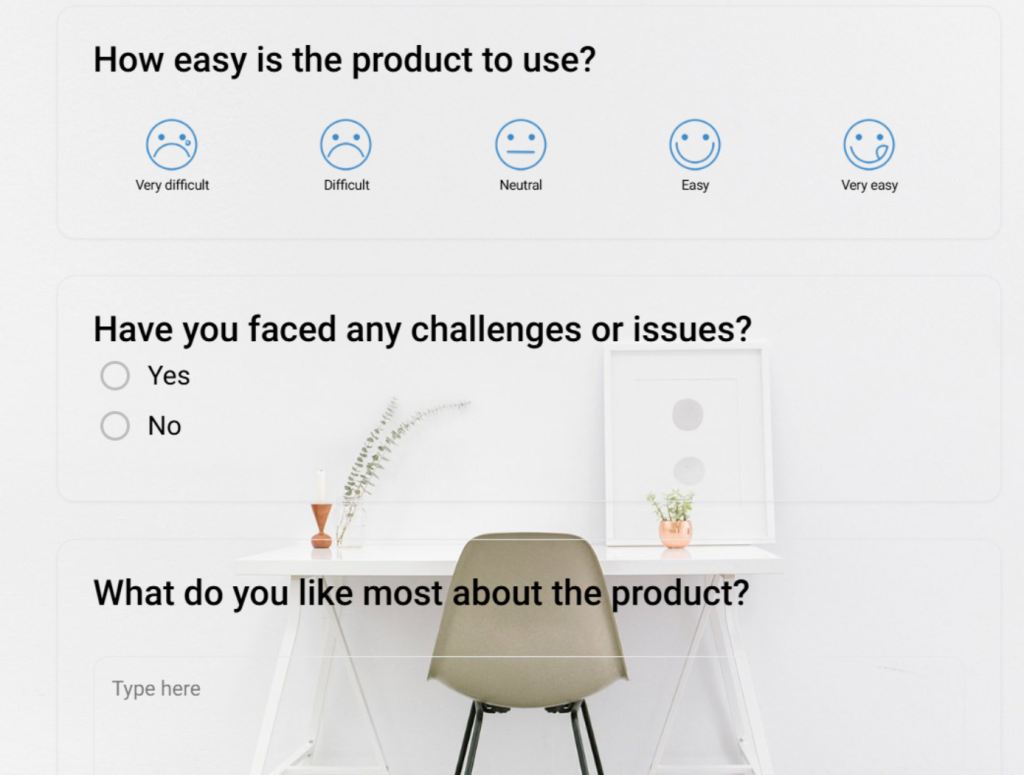
CES measures how much effort a customer had to put in to accomplish a task with your business. The underlying insight: reducing friction drives loyalty more reliably than trying to “delight” customers.
CES is typically measured on a 7-point agreement scale in response to a statement like:
“The company made it easy for me to resolve my issue.”
Lower effort scores correlate with higher repeat purchase rates and lower churn.
Here’s a CES survey template you can use:
How to Calculate CES:
Add all individual scores and divide by the number of respondents.
Example: 10 respondents with scores of 4, 5, 8, 9, 6, 7, 3, 6, 2, 1 give a CES of 5.1.
Where CES Reveals the Most Value:
- After a customer completes a return or refund process
- At the end of a multi-step onboarding flow
- After a customer self-serves through your knowledge base
If your NPS and CSAT scores look fine but churn is still high, CES is often where the answer hides. Customers can be satisfied with outcomes but still leave because the process was too hard.
Pros: Directly predictive of churn. Identifies specific process friction points.
Cons: Does not measure overall loyalty. Less useful for brand-level tracking.
4. Customer Churn Rate
Customer churn rate is the percentage of customers lost in a defined time period relative to your customer base at the start of that period.
It is the most direct financial consequence of low satisfaction. High churn is typically a lagging signal that satisfaction problems went unaddressed earlier in the journey.
Formula:
Churn Rate = (Customers at Start of Period – Customers at End of Period) / Customers at Start of Period x 100
Example: 500 customers at the start of a month and 320 at the end gives a churn rate of 36%.
SaaS Benchmarks for Context: Enterprise SaaS companies aim for monthly churn below 1%. SMB-focused SaaS companies typically see 3% to 7% monthly churn.
Why This Belongs in Your Satisfaction Dashboard:
CSAT and NPS tell you how customers feel. Churn rate tells you what they actually did.
Tracking both together is the only way to confirm whether your satisfaction improvements are translating into retained revenue.
5. Customer Lifetime Value (CLV)
CLV estimates the total revenue a customer generates over the full length of their relationship with your business, after accounting for the cost of acquiring and retaining them.
It is the financial frame that determines how much to invest in satisfaction and retention. Higher satisfaction directly increases CLV by extending the relationship and reducing churn risk.
Simple CLV Formula:
CLV = Customer Revenue – Costs of Acquiring and Retaining the Customer
If your average CLV is $500 and you’re spending $600 to acquire and retain each customer, you have a sustainability problem. The fix almost always runs through satisfaction.
CLV shapes strategy in a practical way: customers with high CLV potential deserve different retention investments than one-time buyers.
Use CLV to segment who gets proactive outreach, who gets NPS follow-ups, and where your CX team focuses energy.
6. Customer Health Score
Customer Health Score is a composite metric used primarily by SaaS and subscription businesses to flag which customers are thriving and which are at risk of churn before they actually leave.
It aggregates behavioral and engagement signals into a single score that predicts whether a customer is likely to renew, expand, or churn.
It combines product usage, billing signals, support volume, and survey scores into one number.
What Goes Into a Customer Health Score:
- Product Signals: Login frequency, feature adoption, active users vs. licensed seats
- Service Signals: Unresolved ticket count, CSAT scores, escalation history
- Relationship Signals: NPS score, time since last meaningful touchpoint, QBR attendance
- Economic Signals: Days since last renewal, billing issues, contract value trend
The health score’s job is to surface the customers who are quietly disengaging before they submit a cancellation.
Teams that build this score and act on it weekly tend to catch churn 60 to 90 days before it would otherwise surface.
7. First Contact Resolution Rate (FCRR)
First Contact Resolution Rate measures the percentage of customer issues resolved the first time a customer contacts your team, without requiring a follow-up.
It is the ratio of support interactions resolved in a single contact to the total number of support contacts. It is one of the strongest predictors of post-interaction CSAT scores.
Formula:
FCRR (%) = Total queries resolved on first interaction / Total queries x 100
Why This Matters: Every additional contact required to resolve an issue increases customer effort and decreases satisfaction. If your CSAT scores on support interactions are low but resolution rates are high, look at response speed. If resolution rates are low, look at agent training and knowledge base quality.
A practical benchmark: World-class contact centers target FCRR above 80% (SQM, 2025).
8. First Response Time (FRT)
First Response Time is the time between when a customer submits a request and when your team first acknowledges it.
It does not measure whether the issue was solved, only how quickly the customer heard back. Fast first responses reduce anxiety and set the tone for the interaction.
Formula:
Average FRT = Sum of all first response times / Total number of tickets
Research validates why this belongs in your satisfaction stack: customers who receive responses within one hour show 71% retention, compared to 48% for those who wait 24 hours.
First response time is often the single fastest lever to improve CSAT scores without changing your product or process.
Reasonable FRT Targets by Channel:
- Live chat: under 1 minute
- Email support: under 4 hours
- Social media: under 2 hours
9. Customer Acquisition Cost (CAC)
Customer Acquisition Cost is the total cost required to win one new customer. When churn rises, acquisition costs follow because you’re spending to replace customers your satisfaction program should have retained.
But tracked alongside CLV and CSAT, it reveals whether your satisfaction investments are paying off.
Formula:
CAC = Total marketing and sales spend / Number of customers acquired
If CAC is rising while CSAT is falling, customers who churn early are forcing you to replace them at increasing cost.
Conversely, when satisfaction and retention improve, CAC decreases because existing customers require fewer replacements and often drive referrals.
The useful insight: if you are tracking NPS and your promoter count is growing, that directly reduces the portion of new customer acquisition that requires paid spend.
10. Customer Ticket Request Volume
Ticket volume is the total number of customer support requests received over a given period.
Spikes in volume are often the earliest signal that a product change, process failure, or communication gap has damaged satisfaction before it shows up in CSAT or NPS scores.
How to Use Ticket Volume as a Satisfaction Signal:
- Compare week-over-week or month-over-month to spot abnormal spikes
- Tag tickets by issue category to identify the top 3 repeating problems
- Cross-reference volume spikes against product releases, pricing changes, or policy updates
A rising ticket volume does not automatically mean customers are unhappy. But when it trends upward alongside declining CSAT, it is a strong signal that something systemic needs fixing.
Here’s a customer satisfaction metrics calculator you can use for all the important metrics like NPS, churn, and more:
How Should You Decide Which Customer Satisfaction Metrics to Track?
You do not need all 10 metrics in place before you start. Most businesses should begin with 2 or 3 and expand from there based on the data.
Here is a practical framework for choosing where to start:
| Your Situation | Start With |
| You have no satisfaction program yet | NPS + CSAT |
| Customers are churning, and you do not know why | CES + Churn Rate |
| Your support team’s performance is unclear | FCRR + FRT + CSAT |
| You want to identify at-risk accounts before they churn | Customer Health Score |
| You are scaling and need to justify the CX investment | CLV + CAC |
The most common mistake is picking metrics because they look sophisticated rather than because they answer a specific business question.
Every metric you track should have an owner and a defined action that triggers when the score moves in the wrong direction.
FREE. All Features. FOREVER!
Try our Forever FREE account with all premium features!
How Do You Set Up a Customer Satisfaction Measurement Program Without Overcomplicating It?
Here is a practical 5-step approach that works for teams at any size:
Step 1: Define Your Question First
Before choosing a metric, write down the decision you need to make.
“Should we invest in retraining our support team?” points to CSAT and FCRR.
“Are our customers at risk of churning after renewal?” points to NPS and Customer Health Score.
Step 2: Build Your Survey in Minutes Using AI
Once you know which metric to track, the blank-page problem is the next thing that slows teams down.
Here is how to go from zero to a live NPS, CSAT, or CES survey using ProProfs Survey Maker’s AI builder:
Here’s the detailed breakdown of steps:
1. Log in and click “Create a Survey.” Select “AI Survey Maker” from the options on the dashboard.
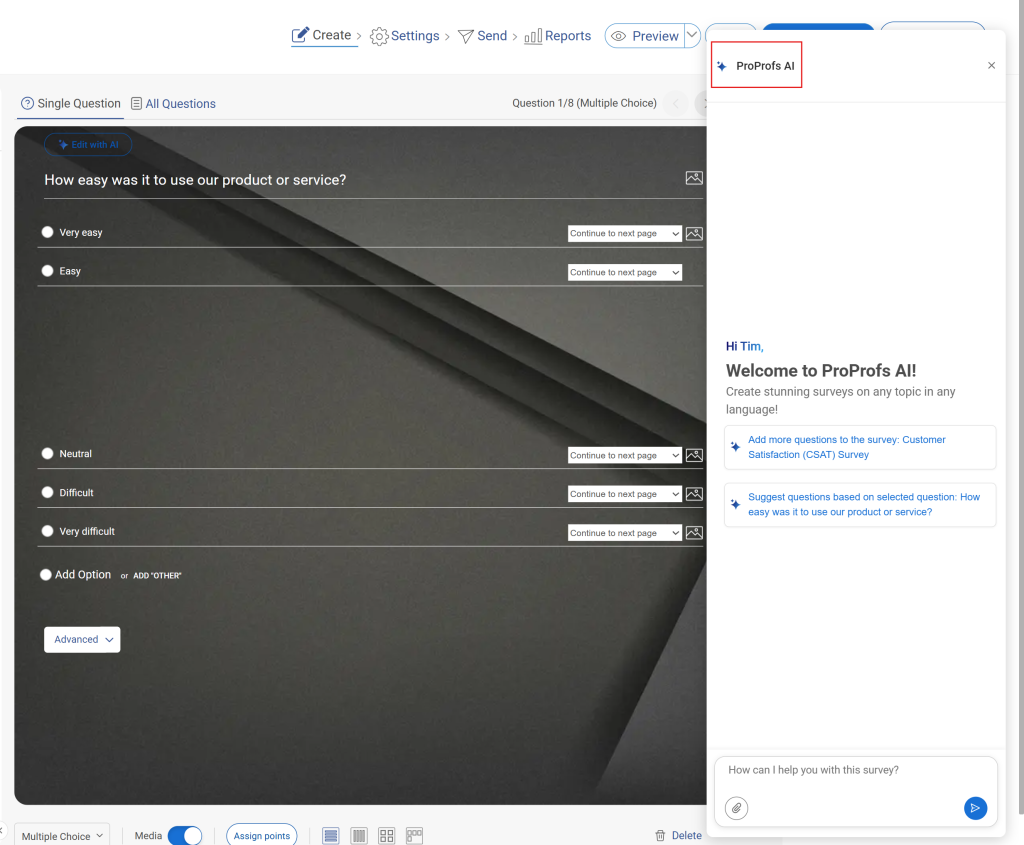
2. Describe your goal in plain language. Type something like “I want to measure customer satisfaction after a support interaction” or “I need an NPS survey for SaaS customers 30 days after onboarding.”
Try it here using this ProProfs Survey Maker AI widget:
Describe your survey and we'll create it for you
The AI reads your intent, not just keywords. Alternatively, upload an existing survey, onboarding script, or customer communication document, and the AI will generate relevant questions from it directly.
3. Review the generated survey. The AI produces a complete survey instantly, with the right question type (NPS scale, CSAT rating, CES agreement scale), a follow-up open-ended question, and logical question order.
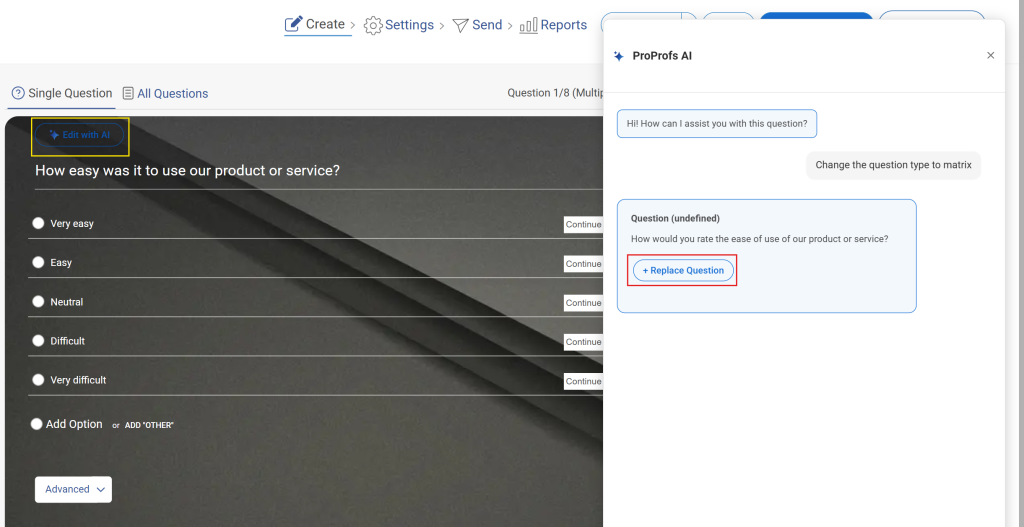
4. Adjust or swap questions if needed. Choose from 1,000,000+ ready-to-use questions across industries, or edit the AI output directly. No question is locked. Apply branching and skip logic for personalized routing.
5. Set the distribution method. Choose email, website embed, QR code, or in-app popup. For post-support CSAT, connect it to your help desk so the survey triggers automatically when a ticket closes.
6. Go live and track scores in real time. The dashboard updates as responses come in. You are not waiting for a monthly export to see where scores are moving.
Step 3: Map Surveys to the Right Touchpoints
The right metric at the wrong moment gives you useless data. Set NPS to send 30 to 90 days after onboarding or quarterly.
Set CSAT to trigger immediately after a support ticket closes or a purchase completes.
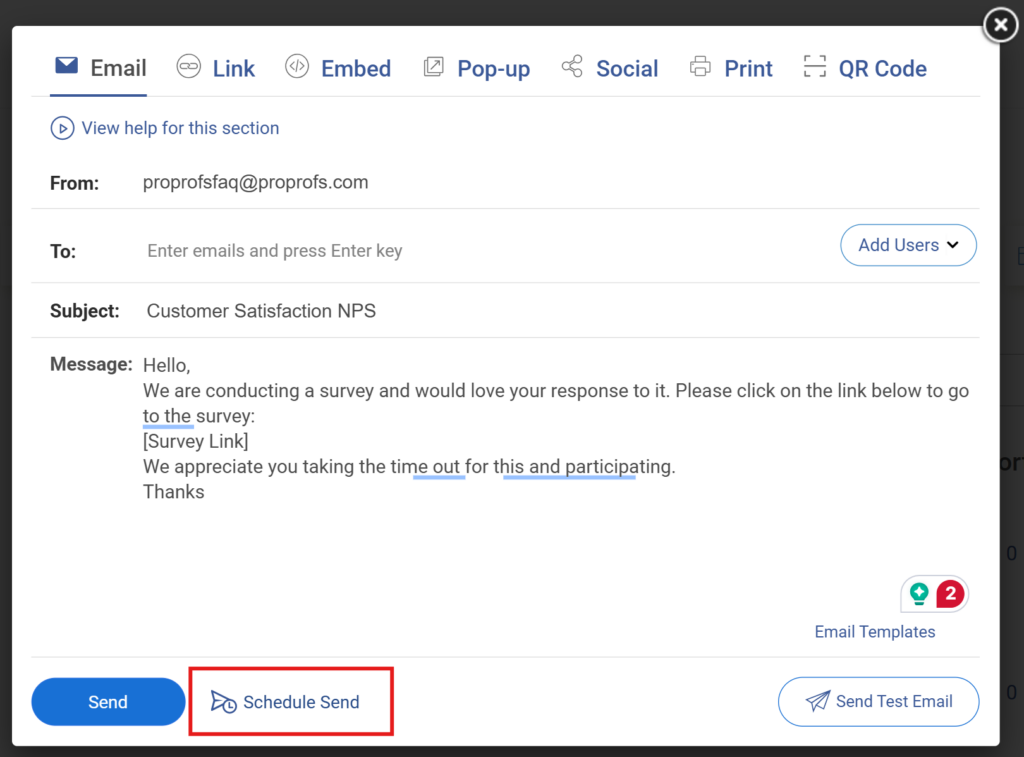
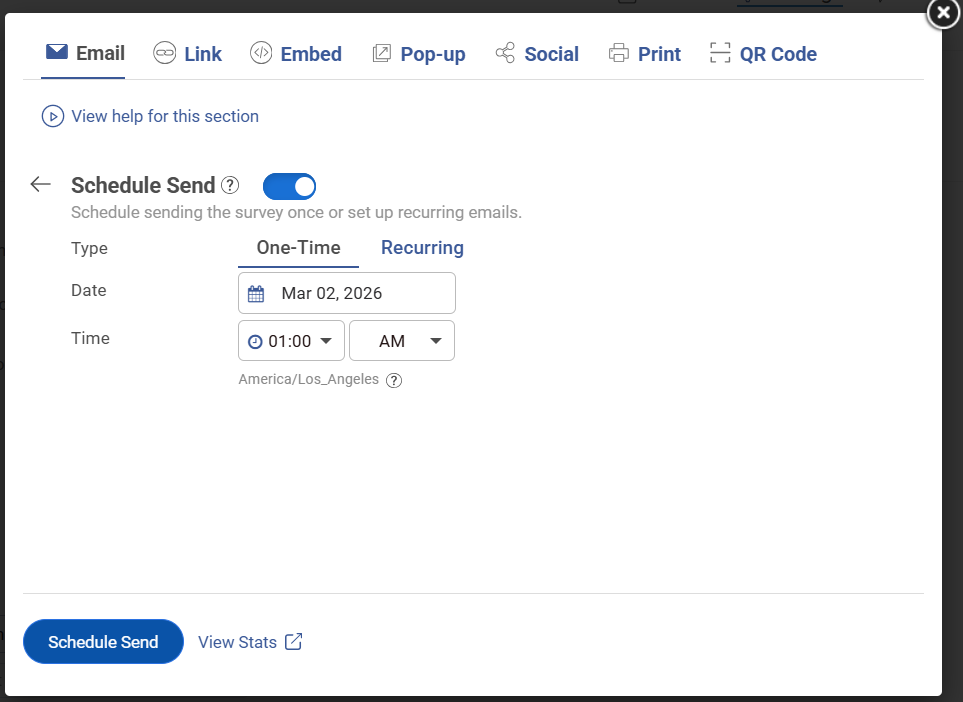
ProProfs Survey Maker lets you schedule your surveys automatically, so surveys go out at the right moment in the journey without manual effort each time.
Step 4: Keep Surveys Short and Always Add One Open-Ended Question
One to three questions per survey maintains response rates.
Add one open-ended follow-up to every rating question: “What is the reason for your score?” That verbatim feedback is where root causes live.
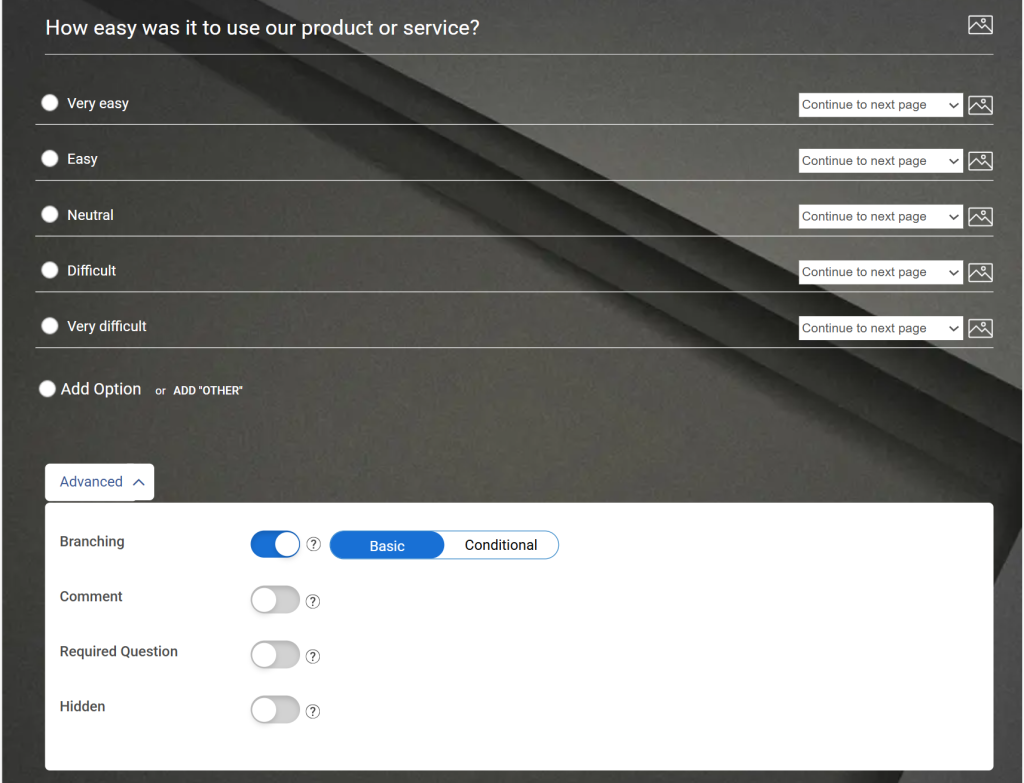
Skip logic lets you show that follow-up only to low scorers, keeping the survey short for satisfied customers while capturing detail from the ones who flagged a problem. Here’s how you can use it:
Step 5: Set Benchmarks and Close the Loop Every Time
Decide what “good” looks like before you collect a single response. Then assign follow-up ownership.
Detractors in your NPS survey should receive personal outreach within 48 hours.
CSAT scores below your threshold should trigger a support manager review.
The real-time dashboard surfaces these scores as responses come in, so your team doesn’t have to wait for a monthly report to act.
What Are the Most Common Mistakes in Tracking Customer Satisfaction Metrics?
Collecting satisfaction data is the easy part. What most teams get wrong is what happens before and after the survey goes out. These are the mistakes that turn a well-intentioned measurement program into a dashboard nobody acts on.
| Mistake | Why It Happens | What to Do Instead |
| Tracking too many metrics at once | Teams want full visibility from day one and end up with a cluttered dashboard nobody owns | Pick two metrics, get clean data for 90 days, then expand based on what the data reveals |
| Ignoring verbatim feedback | Rating scores feel faster to report, so open-ended responses sit unread in the export | Pair every rating question with one open-ended follow-up and review responses weekly, not quarterly |
| Measuring satisfaction only once a year | Annual surveys feel thorough but customer sentiment shifts at every touchpoint throughout the year | Set surveys to trigger automatically at key journey moments: post-purchase, post-support, post-onboarding |
| Using NPS to evaluate individual agents | NPS reflects company-wide brand perception and is unfair as an individual performance measure | Use post-interaction CSAT scores for agent-level coaching. Reserve NPS for team and company trends |
| Never telling customers what changed | Teams fix problems but never communicate the fix, missing the trust-building moment | When a flagged issue is resolved, tell the customers who raised it. That follow-through converts detractors into promoters |
| Benchmarking against the wrong industry | A 74 CSAT score looks poor against restaurants but is strong for social media platforms | Always compare your scores against your specific industry benchmark, not a universal average |
Ready to Turn Customer Satisfaction Metrics Into Action?
The hardest part of building a satisfaction measurement program is not picking the right metrics. It is getting the first survey out the door and into the hands of the right customer at the right moment.
That is the exact problem ProProfs Survey Maker is built to solve. Describe your goal, and the AI generates a complete NPS, CSAT, or CES survey in seconds.
Set a trigger, and it goes out automatically at the right moment in the journey. Track scores in real time without waiting for a monthly export.
Frequently Asked Questions
What are customer satisfaction metrics?
Customer satisfaction metrics are measurable indicators that show how well your products, services, and support experiences meet customer expectations. Common examples include NPS, CSAT, CES, churn rate, and first contact resolution rate. Each measures a different dimension of the customer experience.
What is the most important customer satisfaction metric?
There is no single most important metric. For overall brand health and long-term loyalty, NPS is the most widely used starting point. For measuring specific interactions like support tickets or purchases, CSAT is more appropriate. Most teams use both together to get a complete picture.
What types of metrics measure customer satisfaction?
Customer satisfaction metrics fall into two types: relationship metrics (NPS, Customer Health Score, CLV), which measure the overall quality of the customer relationship over time, and transactional metrics (CSAT, CES, FRT, FCRR), which measure satisfaction at specific interaction points.
What is a good CSAT score?
A CSAT score above 80% is generally considered strong, but this varies by industry. According to the American Customer Satisfaction Index, full-service restaurants average around 84%, airlines around 77%, and internet service providers significantly lower. Compare your score against your specific industry benchmark rather than a universal number.
How often should you measure customer satisfaction?
NPS is typically measured quarterly or 30 to 90 days after key milestones like onboarding or renewal. CSAT and CES are best measured immediately after specific interactions, like support ticket closures or onboarding calls. Churn rate and ticket volume should be reviewed monthly at minimum.
What is the difference between NPS and CSAT?
NPS measures long-term brand loyalty and whether customers would recommend you to others. CSAT measures satisfaction with a specific recent interaction. NPS is relational and predicts future behavior. CSAT is transactional and captures immediate sentiment. They measure different things and work best when used together.
Can you improve customer satisfaction without a large team?
Yes. The key is measuring at the right touchpoints rather than everywhere at once. A single well-timed NPS or CSAT survey with one open-ended follow-up question can surface more actionable insight than a 20-question annual survey. Start small, close the loop on every negative score, and expand from there.
What should you do when your customer satisfaction score drops?
First, check whether the drop correlates with a specific event: a product update, a pricing change, a staffing change in support. Then pull verbatim feedback from that period to identify the most frequently mentioned issues. Prioritize fixing the top one or two root causes before adding new measurement complexity. Communicate fixes to your customers once changes are made.
FREE. All Features. FOREVER!
Try our Forever FREE account with all premium features!
 We'd love your feedback!
What did you like & how can we make it even better?

 Thanks for your feedback!
 Ask Your Question
Have a question? Get expert help to make your decision easier.