


Ever wondered how companies figure out what we want? The answer lies in numbers. Quantitative research is the art of turning numerical data into valuable insights by uncovering hidden trends and patterns.
From understanding customer behaviors to making smarter business decisions, numbers can tell a powerful story.
In this blog, we’ll explore how this research method can help your business and learn about its types, examples, and expert-backed tips.
What Is Quantitative Research?
Quantitative research is a method that uses numbers and statistics to gather precise, measurable data on the research subject. Quantitative research clarifies the fuzziness of research data from qualitative research analysis. With numerical insights, you can formulate a better and more profitable business decision.
Offering numbers and stats-based insights, this research methodology is a crucial part of primary research and helps understand how well an organizational decision will work out.
This approach mainly uses online surveys, questionnaires, polls, and quizzes to collect measurable and unbiased data from large groups.

For example, qualitative research can let you know whether your product is a hit or miss, but quantitative data allows you to know exactly what percentage of consumers like it, and what numbers think you still need to improve. As a result of this precision, you can make decisions that are likely to be more in tune with the market demands.
Quantitative research thus provides crucial, numbers-based insights that help organizations make informed decisions and predict outcomes effectively.
Characteristics of Quantitative Research
Quantitative research is more readily contestable, sharpens intelligent discussion, helps you see the rival hypotheses, and dynamically contributes to the research process.
Let us have a quick look at some of its characteristics.
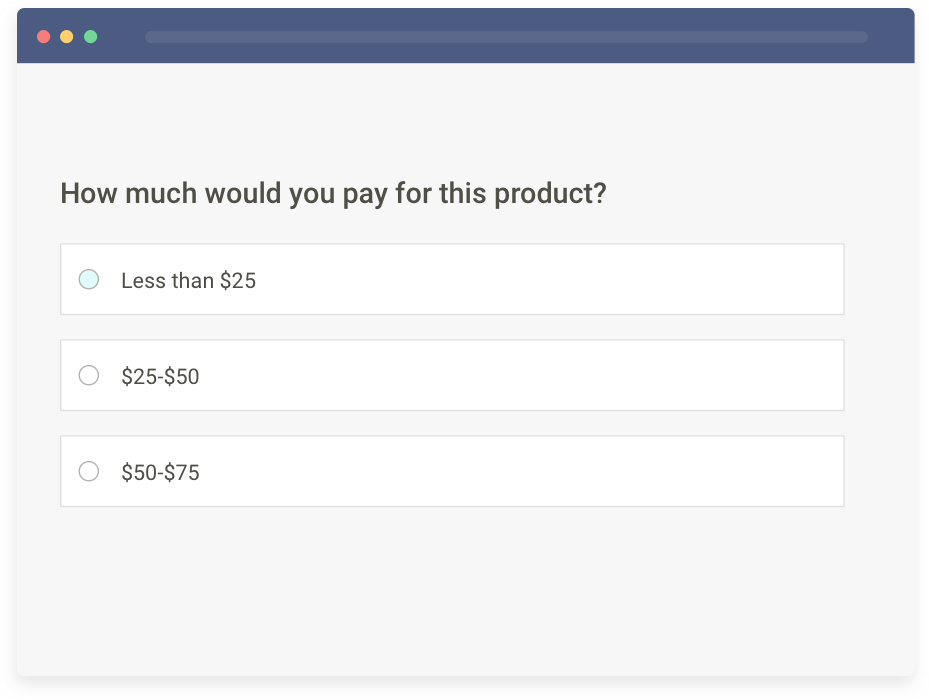
1. Measurable Variables
The data collection methods in quantitative research are structured and contain items requiring measurable variables, such as age, number of family members, salary range, highest education, etc.
These structured data collection methods comprise polls, surveys, questionnaires, etc., and may have questions like the ones shown in the following image:

As you can see, all the variables are measurable. This ensures the research is in-depth and provides less erroneous data for reliable, actionable insights.
2. Sample Size
No matter what data analysis methods are used for quantitative research, the sample size is kept small enough to represent the target market.
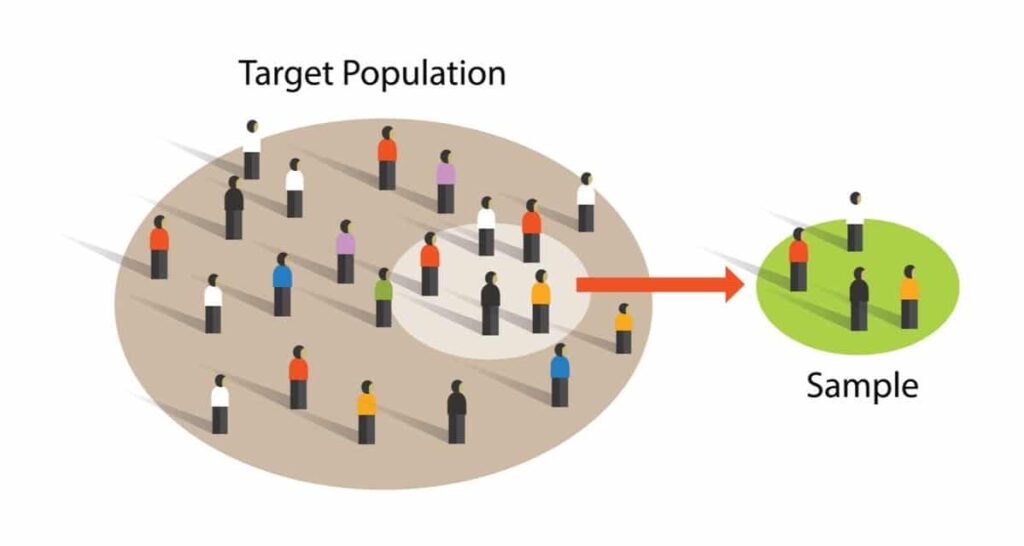
Source
The main aim of the research methodology is to obtain numerical insights, so the sample size should be fairly large. Depending on the survey objective and scope, it might include hundreds of thousands of people.
3. Normal Population Distribution
To maintain the reliability of a quantitative research methodology, we assume that the population distribution curve is normal.
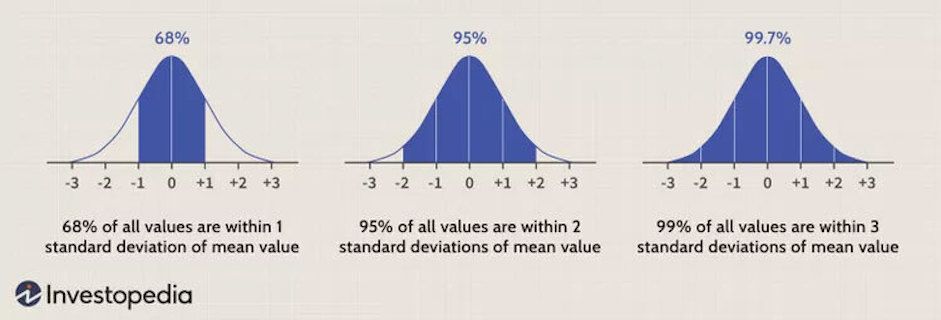
This type of population distribution curve is preferred over a non-normal distribution as the sample size is large, and the characteristics of the sample vary with its size.
This requires adhering to the random sampling principle to avoid the researcher’s bias in interpreting the results. Any bias can ruin the fairness of the entire process and defeat the purpose of the research.
4. Well-Structured Data Representation
Data analysis in quantitative research produces highly structured results and can form well-defined graphical representations. Some common examples include tables, figures, graphs, etc., that combine large blocks of data.
This way, you can discover hidden data trends, relationships, and differences among various measurable variables. This can help researchers understand the survey data and formulate actionable insights for decision-making.
5. Predictable Outcomes
Quantitative data analysis can also be used to estimate and predict outcomes. You can construct if-then scenarios and analyze the data to identify upcoming trends or events.
However, this requires advanced analytics and involves complex mathematical computations. So, it is mostly done via quantitative research tools with advanced analytics capabilities.
What Are the Types and Examples of Quantitative Research?
Quantitative research is usually conducted using two methods. They are-
- Primary quantitative research methods
- Secondary quantitative research methods
Let’s discuss each type in detail.
I. Primary Methods
Primary quantitative research is the most popular method of conducting market research. This method differs from others in that the researcher collects data firsthand instead of using data collected from previous research.
There are multiple types of primary quantitative research. They can be distinguished based on three distinctive aspects: Techniques & types of studies, Data collection methodologies, and Data analysis techniques.
A. Techniques & Types of Studies:
1. Survey Research
Surveys are the easiest, most common, and one of the most sought-after quantitative research techniques. The main aim of a survey is to widely gather and describe the characteristics of a target population or customers. Surveys are the foremost quantitative method preferred by both small and large organizations.
Surveys can be conducted using various methods, such as online polls, web-based surveys, paper questionnaires, phone calls, or face-to-face interviews. Survey research allows organizations to understand customer opinions, preferences, and behavior, making it crucial for market research and decision-making.
For example, a retail brand might send post-purchase surveys to track customer satisfaction and spot patterns in low-rated products. After noticing repeated complaints about product sizing, the team adjusted their sizing guide and saw a drop in returns over the next quarter. This is how even a simple survey can lead to measurable business improvements.
You can watch this quick video to learn more about creating surveys.
Watch: How to Create a Survey Using ProProfs Survey Maker
Surveys, again, are of two types:
2. Cross-Sectional Surveys
Cross-sectional surveys are used to collect data from a sample of the target population at a specific point in time. Researchers evaluate various variables simultaneously to understand the relationships and patterns within the data.
In healthcare, hospitals often run discharge surveys to assess patient satisfaction with a single visit. The results might show patterns like long wait times or unclear post-care instructions. By addressing those areas, hospitals can improve both patient experience and overall care quality, without needing to collect data over months.
Cross-sectional surveys are popular in retail, small and medium-sized enterprises (SMEs), and healthcare industries, where they assess customer satisfaction, market trends, and product feedback.
3. Longitudinal Surveys
Longitudinal surveys are conducted over an extended period, observing changes in respondent behavior and thought processes.
In education, universities often send follow-up surveys to alumni at regular intervals, 6 months, 1 year, and 3 years after graduation. These surveys track employment status, salary growth, and satisfaction with the course. The data helps institutions improve career support, curriculum relevance, and long-term outcomes for future students.
Researchers gather data from the same sample multiple times, enabling them to study trends and developments over time. These surveys are valuable in fields such as medicine, applied sciences, and market trend analysis.
4. Correlational Research:
Correlational research looks at how two things are related, but it doesn’t mean one causes the other.
For example, HR teams might check if low employee engagement is linked to high turnover. If teams with low engagement often have more people quitting, that could be a sign to improve things like feedback, training, or workload. This kind of research helps spot patterns, but it doesn’t prove one thing causes another. It just shows how changes in one area might be connected to changes in another.
Some common examples include looking at the link between stress and depression, money and fame, or how classroom activities relate to student performance.
5. Causal-Comparative Research:
Causal-comparative research, or quasi-experimental research, seeks to determine cause-and-effect relationships between variables.
Researchers analyze how an independent variable influences a dependent variable, but they do not manipulate the independent variable. Instead, they observe and compare different groups to draw conclusions.
This method is especially useful when it’s not ethical or feasible to run controlled experiments.
For example, a SaaS company might want to assess whether having access to live customer support affects subscription renewal rates. Instead of assigning support randomly, they compare two existing customer groups: those who used live chat frequently and those who didn’t. If the renewal rate is consistently higher among users with support access, it suggests a meaningful relationship, even without direct intervention.
Other common use cases include analyzing the effect of employee training on performance or evaluating how supply chain delays affect delivery satisfaction scores.
6. Experimental Research:
Experimental research is based on testing theories to validate or disprove them. Researchers conduct experiments and manipulate variables to observe their impact on outcomes.
This type of research is common in both natural and social sciences, and it’s the most reliable way to establish cause-and-effect relationships. By randomly assigning participants to control and experimental groups, researchers can isolate the impact of specific changes.
For example, a SaaS company might test two onboarding flows to see which one helps users activate faster. Half the users see a guided tutorial, while the other half gets a basic walkthrough. After running the test for two weeks, they compare activation rates between the groups. If the guided tutorial drives more completions, it becomes the default.
Experimental research is especially useful when you need clear, measurable results and have the ability to control variables directly.
B. Data Collection Methodologies
After defining research objectives, the next significant step in primary quantitative research is data collection. This involves using two main methods: sampling and conducting surveys or polls. Quantitative research can also be categorized according to their sampling methods.
In quantitative research, there are two primary sampling methods: Probability and Non-probability sampling.
1. Probability Sampling
In probability sampling, researchers use the concept of probability to create samples from a population. This method ensures that every individual in the target audience has an equal chance of being selected for the sample.
There are four main types of probability sampling:
- Simple random sampling: Here, the elements or participants of a sample are selected randomly, and this technique is used in studies that are conducted over considerably large audiences. It works well for large target populations.
- Stratified random sampling: In this method, the entire population is divided into strata or groups, and the sample members get chosen randomly from these strata only. It is always ensured that different segregated strata do not overlap with each other.
- Cluster sampling: Here, researchers divide the population into clusters, often based on geography or demographics. Then, random clusters are selected for the sample.
- Systematic sampling: In this method, only the starting point of the sample is randomly chosen. All the other participants are chosen using a fixed interval. Researchers calculate this interval by dividing the size of the study population by the target sample size.
2. Non-probability Sampling
Non-probability sampling is a method where the researcher’s knowledge and experience guide the selection of samples. This approach doesn’t give all members of the target population an equal chance of being included in the sample.
There are five non-probability sampling models:
- Convenience sampling: The elements or participants are chosen on the basis of their nearness to the researcher. The people in close proximity can be studied and analyzed easily and quickly, as there is no other selection criterion involved. Researchers simply choose samples based on what is most convenient for them.
- Consecutive sampling: Similar to convenience sampling, researchers select samples one after another over a significant period. They can opt for a single participant or a group of samples to conduct quantitative research in a consecutive manner for a significant period of time. Once this is over, they can conduct the research from the start.
- Quota sampling: With quota sampling, researchers use their understanding of target traits and personalities to form groups (strata). They then choose samples from each stratum based on their own judgment.
- Snowball sampling: This method is used where the target audiences are difficult to contact and interviewed for data collection. Researchers start with a few participants and then ask them to refer others, creating a snowball effect.
- Judgmental sampling: In judgmental sampling, researchers rely solely on their experience and research skills to handpick samples that they believe will be most relevant to the study.
C. Data Analysis Techniques
Once the raw data is collected, the next step in primary quantitative research is data analysis. This crucial process helps draw inferences from the research. It’s essential to connect the results with the objectives and determine their statistical significance.
To analyze the quantitative data accurately, you’ll need to use specific statistical methods such as:
- SWOT Analysis: This stands for Strengths, Weaknesses, Opportunities, and Threats analysis. Organizations use SWOT analysis to evaluate their performance internally and externally. It helps develop effective improvement strategies.
- Conjoint Analysis: This market research method uncovers how individuals make complex purchasing decisions. It involves considering trade-offs in their daily activities when choosing from a list of product/service options.
- Cross-tabulation: A preliminary statistical market analysis method that reveals relationships, patterns, and trends within various research study parameters.
- TURF Analysis: Short for Totally Unduplicated Reach and Frequency Analysis, this method helps analyze the reach and frequency of favorable communication sources. It provides insights into the potential of a target market.
By using these statistical techniques and inferential statistics methods like confidence intervals and margin of error, you can draw meaningful insights from your primary quantitative research that you can use in making informed decisions.
Sample workflow for analyzing survey data
After choosing your analysis methods, the next step is applying them effectively. Here is a simple workflow you can follow to analyze your quantitative survey data and extract actionable insights:
- Export your data to CSV format from your survey tool.
- Clean the data by removing incomplete or invalid responses.
- Import the data into statistical software like R or SPSS.
- Run basic descriptive statistics (mean, median, standard deviation) to understand overall patterns.
- Perform inferential tests such as t-tests or ANOVA to compare responses between groups.
- Use regression analysis to explore relationships between variables and predict outcomes.
- Visualize your results to make them easier to interpret and share with stakeholders.
Visualizing your data for better insights
Well-structured visualizations help bring your data story to life. They make complex relationships and trends easier to understand at a glance. Here are some commonly used visual formats:
- Bar charts to compare responses across categories.
- Line graphs to display trends over time.
- Pie charts to show proportions of different response options.
- Heatmaps to reveal patterns across cross-tabulated variables.
- Scatter plots to examine correlations between variables.
By combining sound statistical techniques with clear visual presentation, you can make your primary quantitative research findings both meaningful and easy to act upon.
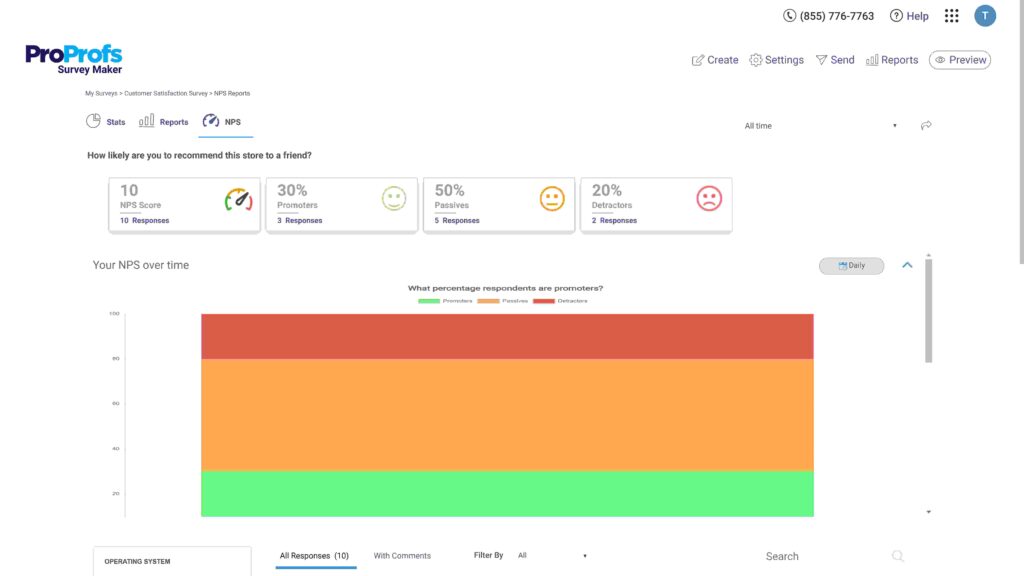
Make your survey data actually useful
Once your survey is live, ProProfs Survey Maker automatically starts tracking responses. You don’t need to set up anything.
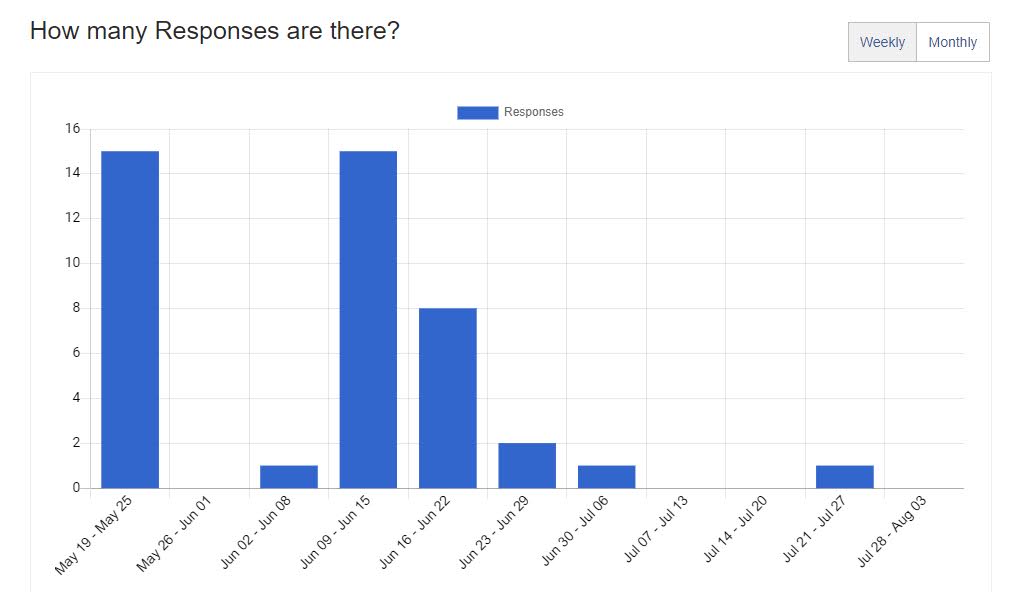
As data comes in, go to the “Reports” tab in your dashboard. There, you’ll see response summaries and auto-generated charts for each question.
Want to analyze a specific question? Use the dropdown to filter results by that item. Need to track how responses changed over time? Select a custom date range.
For deeper analysis, click “Export” to download the data as Excel or CSV, ready for pivot tables, custom charts, or sharing with your team.
This is how you move from collecting survey responses to actually making sense of them, without drowning in spreadsheets.
II. Secondary Methods
Secondary quantitative research, also known as desk research, is a valuable method that uses existing data, called secondary data.
Instead of collecting new data, researchers analyze and combine already available information to enhance their research. This approach involves gathering quantitative data from various sources such as the internet, government databases, libraries, and research reports.
Secondary quantitative research is crucial in validating data collected through primary quantitative research. It helps reinforce or challenge existing findings.
Here are five commonly used secondary quantitative research methods:
A. Data Available on the Internet:
The Internet has become a vast repository of data, making it easier for researchers to access a wealth of information. Online databases, websites, and research repositories provide valuable quantitative data for researchers to analyze and validate their primary research findings.
B. Government and Non-Government Sources:
Government agencies and non-government organizations often conduct extensive research and publish reports. These reports cover a wide range of topics, providing researchers with reliable and comprehensive data for quantitative analysis.
C. Public Libraries:
While less commonly used in the digital age, public libraries still hold valuable research reports, historical data, and publications that can contribute to quantitative research.
D. Educational Institutions:
Educational institutions frequently conduct research on various subjects. Their research reports and publications can serve as valuable sources of information for researchers, validating and supporting primary quantitative research outcomes.
E. Commercial Information Sources:
Commercial sources such as local newspapers, journals, magazines, and media outlets often publish relevant data on economic trends, market research, and demographic analyses. Researchers can access this data to supplement their own findings and draw better conclusions.
Now, let’s discuss some real-world examples of quantitative research.
Here are two excellent examples of quantitative research methods used by highly distinguished business and consulting organizations. Both examples show how different types of analysis can be performed with qualitative approaches and how the analysis is done once the data is collected.
1. STEP Project Global Consortium / KPMG 2019 Global Family Business Survey
This research utilized quantitative methods to identify ways that kept the family businesses sustainably profitable with time.
The study also identified the ways in which the family business behavior changed with demographic changes and had “why” and “how” questions. Their qualitative research methods allowed the KPMG team to dig deeper into the mindsets and perspectives of the business owners and uncover unexpected research avenues as well.

It was a joint effort in which STEP Project Global Consortium collected 26 cases, and KPMG collected 11 cases.
The research reached the stage of data analysis in 2020, and the analysis process spanned over 4 stages.
The results, which were also the reasons why family businesses tend to lose their strength with time, were found to be:
- Succession
- Family governance
- Family business legacy
2. EY Seren Teams Research 2020
This is yet another commendable example of qualitative research where the EY Seren Team digs into the unexplored depths of human behavior and how it affected their brand or service expectations.
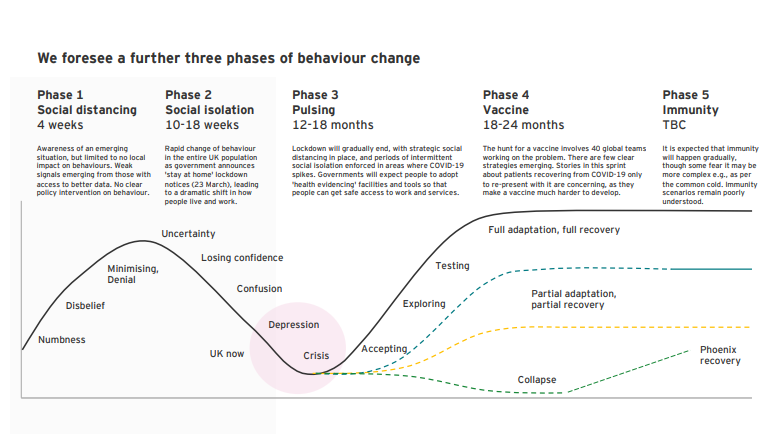
The research was done across 200+ sources and involved in-depth virtual interviews with people in their homes, exploring their current needs and wishes. It also involved diary studies across the entire UK customer base to analyze human behavior changes and patterns.
The study also included interviews with professionals and design leaders from a wide range of industries to explore how COVID-19 transformed their industries. Finally, quantitative surveys were conducted to gain insights into the EY community after every 15 days.
The insights and results were:
- A culture of fear, daily resilience, and hopes for a better world and a better life – these were the macro trends.
- People felt massive digitization was a resourceful yet demanding aspect as they had to adapt every day.
- Some people wished to have a new world with lots of possibilities, and some were looking for a new purpose.
Advantages of Quantitative Research
Quantitative research data is often standardized and can be easily used to generalize findings for making crucial business decisions and uncover insights to supplement the qualitative research findings.
Here are some core benefits this research methodology offers.
A. Objectivity and Reliability
- Unbiased Insights: By relying on numerical data, quantitative research minimizes researcher bias, leading to more objective findings.
- Reproducibility: The standardized methods used in quantitative research allow for the replication of studies, enhancing the reliability and credibility of results.
B. Efficiency and Scalability
- Large Sample Sizes: Quantitative methods enable researchers to gather data from large populations, providing a comprehensive understanding of trends and patterns.
- Rapid Data Collection: Efficient data collection techniques, such as online surveys, expedite the research process.
- Cost-Effective: Compared to qualitative research, quantitative methods can be more cost-effective due to their efficiency and scalability.
C. Precision and Generalizability
- Numerical Precision: Quantitative data provides precise measurements and statistical analysis, allowing for accurate comparisons and predictions.
- Generalizability: Findings from large, representative samples can be generalized to the broader population more confidently.
D. Data-Driven Decision-Making
- Informed Choices: Quantitative research offers actionable insights to inform strategic decisions in business, healthcare, policymaking, and other fields.
- Performance Measurement: By tracking key performance indicators (KPIs), organizations can measure the effectiveness of their initiatives and make necessary adjustments.
FREE. All Features. FOREVER!
Try our Forever FREE account with all premium features!
Disadvantages of Quantitative Research
Despite its numerous benefits, quantitative research has some cons as well, such as:
A. Lack of Depth and Context
Quantitative research excels at providing numerical data but falls short when it comes to understanding the underlying reasons for behaviors or opinions. It offers a snapshot of what happened but not necessarily why it happened. Researchers may struggle to delve into the complexities of human experiences and motivations.
B. Overreliance on Structured Data
The rigid nature of quantitative research limits the exploration of unexpected findings. Researchers are confined to pre-determined questions and response options, potentially overlooking valuable insights from open-ended exploration.
C. Potential for Bias
While striving for objectivity, quantitative research is not immune to bias. Factors such as sample selection, question-wording, and data analysis methods can introduce biases that distort the results. Careful planning and execution are essential to mitigate these risks.
E. Difficulty Establishing Causality
Correlation does not equal causation. While quantitative research can identify relationships between variables, establishing definitive cause-and-effect links is challenging. Other factors may influence the observed relationship, making it difficult to isolate the true cause.
F. Resource Intensive
Conducting quantitative research often requires significant time and financial resources. Collecting large datasets, employing statistical analysis, and ensuring data quality can be costly and time-consuming. Additionally, specialized expertise may be needed for data analysis and interpretation.
When to Use Quantitative Research
Quantitative research is particularly suited for the following scenarios:
1. Testing Hypotheses and Theories
- Hypothesis Verification: When you have a specific prediction about a relationship between variables, quantitative research can be used to test its validity.
- Theory Building: By gathering numerical data, you can identify patterns and trends that contribute to the development of new theories or the refinement of existing ones.
2. Measuring and Comparing
- Market Research: Assessing market size, share, and customer preferences to inform product development or marketing strategies.
- Performance Evaluation: Quantifying the effectiveness of programs, policies, or interventions through metrics and benchmarks.
- Comparative Analysis: Comparing different groups or conditions to identify similarities, differences, and relationships.
3. Generalizing Findings
- Population Representation: When you aim to draw conclusions about a larger population based on a representative sample.
- Predictive Modeling: Building models to forecast future trends or outcomes based on historical data.
4. Identifying Cause-and-Effect Relationships
- Experimental Design: While challenging, quantitative research can be used to establish causal relationships through controlled experiments.
- Correlational Analysis: Identifying patterns and associations between variables, though caution is needed to avoid assuming causation.
In essence, quantitative research is most appropriate when you seek precise, measurable data to answer specific research questions and make informed decisions.
What Is the Purpose of Quantitative Research?
Quantitative research is the backbone of evidence-based decision-making. Its core purpose is to transform raw data into actionable insights. Researchers can uncover hidden patterns, trends, and relationships that might otherwise go unnoticed by employing statistical methods to analyze numerical information.
Here’s an in-depth analysis of its true objectives:
- Prediction: Quantitative research excels at forecasting future trends or outcomes. By identifying historical patterns, researchers can model potential scenarios and make informed predictions.
- Generalization: By studying a representative sample, researchers can draw conclusions about a larger population. This allows for extrapolating findings to broader groups, providing valuable insights for businesses, policymakers, and scientists.
- Testing Hypotheses: Quantitative research is essential for testing theories and hypotheses. By collecting empirical data, researchers can determine if their assumptions are supported by evidence.
- Measuring Outcomes: Evaluating the effectiveness of interventions or programs is a key application of quantitative research. By tracking specific metrics, researchers can assess the impact of initiatives and make necessary adjustments.
- Understanding Relationships: This research method helps uncover correlations and causal relationships between variables. By identifying how factors influence each other, researchers can develop strategies to optimize outcomes.
Best Practices for Conducting Quantitative Research
Here are some best practices to keep in mind while conducting quantitative research:
1. Understand Your Research Objectives
There are many ways to collect data via quantitative research methods chosen according to the research objective and scope. These methods allow you to make your own observations regarding any hypotheses—unknown, entirely new, or unexplained.
Based on that, you can hypothesize proof and build a prediction of outcomes that support the same. You can also create a detailed stepwise plan for data collection, analysis, and testing.
2. Keep Your Questions Simple
The surveys are meant to reach people en-masse, including a wide demographic range with recipients from all walks of life. Asking simple questions will ensure that they grasp what’s being asked easily.
| Read More – Proven Tips to Avoid Leading and Loaded Questions in Your Survey |
3. Develop a Solid Research Design
Choose an appropriate research design that aligns with your objectives, whether experimental, quasi-experimental, or correlational. You also need to pay attention to the sample size and sampling technique so that they accurately represent the target population.
4. Use Reliable & Valid Instruments
It’s crucial to select or develop measurement instruments such as questionnaires, scales, or tests that have been validated and are reliable. Before proceeding with the main study, pilot-test these instruments on a small sample to assess their effectiveness and make any necessary improvements.
5. Ensure Data Quality
Double-check data entries and cleaning procedures to eliminate any inconsistencies or missing values that may affect the accuracy of your results. For instance, you might regularly cross-verify data entries to identify and correct any discrepancies.
6. Employ Appropriate Data Analysis Techniques
Select statistical methods that match the nature of your data and research questions. Whether it’s regression analysis, t-tests, ANOVA, or other techniques, using the right approach is important for drawing meaningful conclusions. Utilize software tools like SPSS or R for data analysis to ensure the accuracy and reproducibility of your findings.
7. Interpret Results Objectively
Present your findings clearly and unbiasedly. Avoid making unwarranted causal claims, especially in correlational studies. Instead, focus on describing the relationships and patterns observed in your data.
8. Address Ethical Considerations
Prioritize ethical considerations throughout your research process. Obtain informed consent from participants, ensuring their voluntary participation and confidentiality of data. Comply with ethical guidelines and gain approval from a governing body if necessary.
| Read More – How to Find Survey Participants & Respondents |
FREE. All Features. FOREVER!
Try our Forever FREE account with all premium features!
Enhance Your Quantitative Research With Cutting-Edge Software
While no single research methodology can produce 100% reliable results, you can always opt for a hybrid method by selecting the most relevant methods for your objective.
For the best results, opt for smart, efficient, and scalable research tools that offer delightful reporting and advanced analytics. These tools will make every research initiative a success.
Advanced software tools, such as ProProfs Survey Maker, come with pre-built survey templates and question libraries and allow you to create a high-converting survey in just a few minutes.
FREE. All Features. FOREVER!
Try our Forever FREE account with all premium features!
 We'd love your feedback!
What did you like & how can we make it even better?

 Thanks for your feedback!
 Ask Your Question
Have a question? Get expert help to make your decision easier.