Most surveys get abandoned halfway through. Not because people don’t care, but because the survey asks too much of them.
Too many screens. Too many format changes. Too much reading. People give up, and you end up with incomplete data that doesn’t tell you anything useful.
A matrix survey is the fix. You put related questions into one grid, give them a shared scale, and let respondents move through the whole thing in one go. Less friction, more completions, cleaner data.
In this guide, I will show you exactly how to build one. You’ll get real question sets you can copy, a one-table decision guide for picking the right question type, and a real example of how a company runs a monthly matrix survey to improve their business.
What Is a Matrix Survey?
It’s a grid. Rows are your questions. Columns are your answer options. Every row uses the same scale.
Once a respondent figures out the format after the first row, the rest goes fast. That’s the whole point.
Say you’re collecting post-transaction feedback for a real estate company. You want to know how customers felt about agent responsiveness, communication, property knowledge, paperwork handling, and overall experience.
You could ask five separate questions. Or you put all five in one grid with a five-point scale and get the same answers in half the time.
Use a Matrix Survey When:
- You have four to eight related questions that share the same answer scale
- You need scores you can compare across attributes or track over time
- You’re running the same survey repeatedly and need consistent, comparable data
Don’t Use It When:
- Your questions cover different topics that don’t share a scale
- You need detailed open-ended answers per question
- Most of your audience is on mobile and you have more than four columns
- You’re in a regulated space that requires WCAG-accessible survey formats
How Do You Build a Matrix Survey That People Actually Finish?
Here’s how I’d approach it, step by step, in the order that actually matters.
I used ProProfs Survey Maker in these examples because it combines ready-made survey templates, an AI survey builder, and easy matrix question setup in one place.
All this makes it a practical tool for building structured surveys quickly, even if you’re not a trained survey designer.
1. Start With a Template
Seriously, don’t start from scratch. Building a matrix survey from a blank page takes twice as long and usually produces a worse result because there’s no structure to push back against.
Pre-built templates for CSAT, employee engagement, 360 feedback, and product research already have the right question groupings, scale types, and row limits baked in. You edit, not build.
With ProProfs Survey Maker, you can start with a ready-made template and customize it in minutes.
Steps to start with a template in ProProfs Survey Maker:
Log in to your ProProfs Survey Maker dashboard.
Click Create Survey.
Select Create Using Templates.
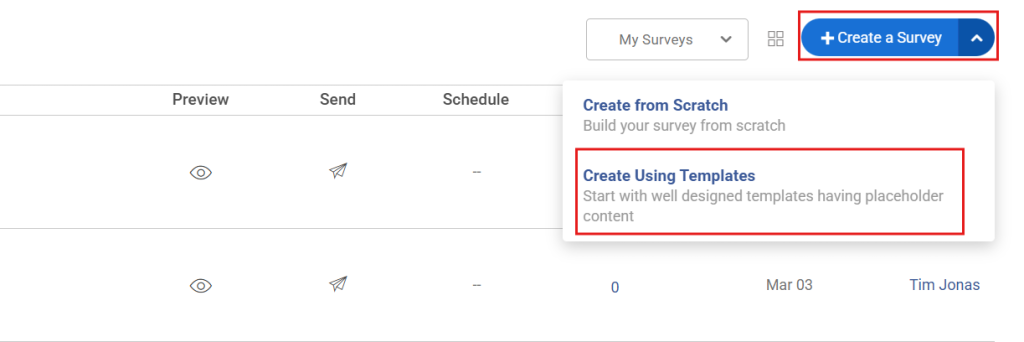
Browse the template library (CSAT, Employee Engagement, Training Feedback, etc.).

Choose a template that includes matrix-style questions, for example, a CSAT survey template.
Click Use Template and start editing the questions, scale labels, and sections.
Your starting point is already halfway right before you write a single question.
OR
You can simply ask ProProfs AI to build a survey for you:

2. Use AI to Draft Your Question Set
Wording matters more than most people realize. “Our support team resolved my issue quickly” and “My issue was resolved in a timely manner” are not the same question. They produce different data.
Instead of manually drafting every row, use AI to generate a structured question set first.
The AI Survey Builder in ProProfs Survey Maker can generate survey questions from a topic, and then you refine them.
Here’s a quick video for you to create your surveys with AI:
Steps to generate questions using AI:
1. From the dashboard, select ProProfs AI.
2. You’ll enter:
- What the survey is about (short description)
- A brief explanation of your goal
- The question type (multiple choice or rating scale)
- The number of questions to generate

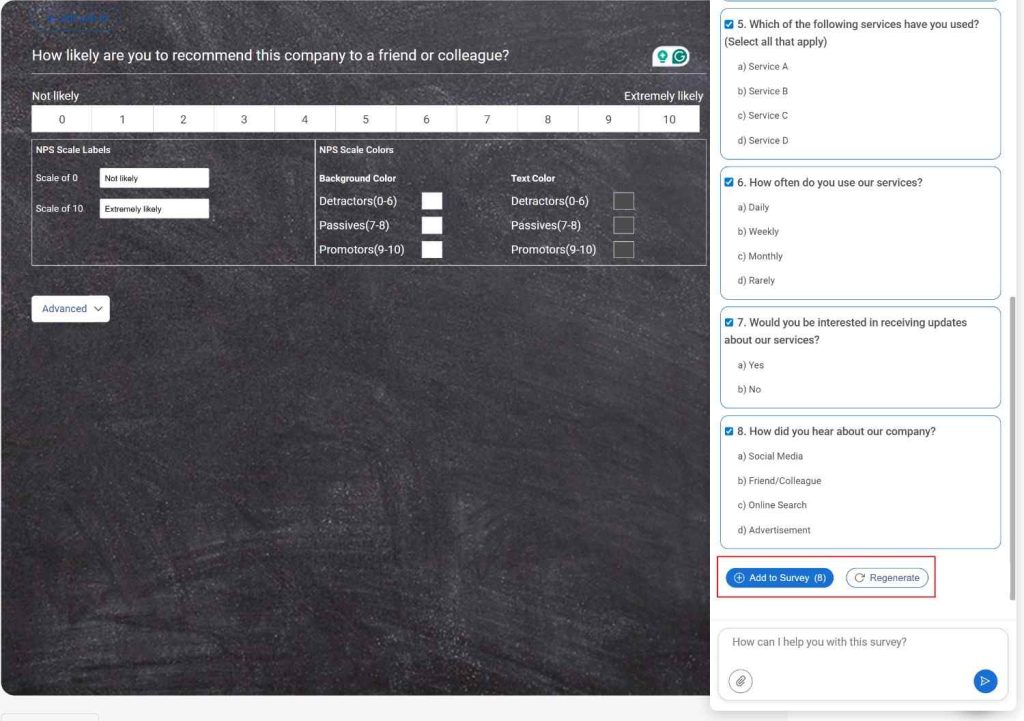
3. Click Generate Survey.
4. Review the AI-generated questions.
5. Convert relevant questions into a Matrix Question format.
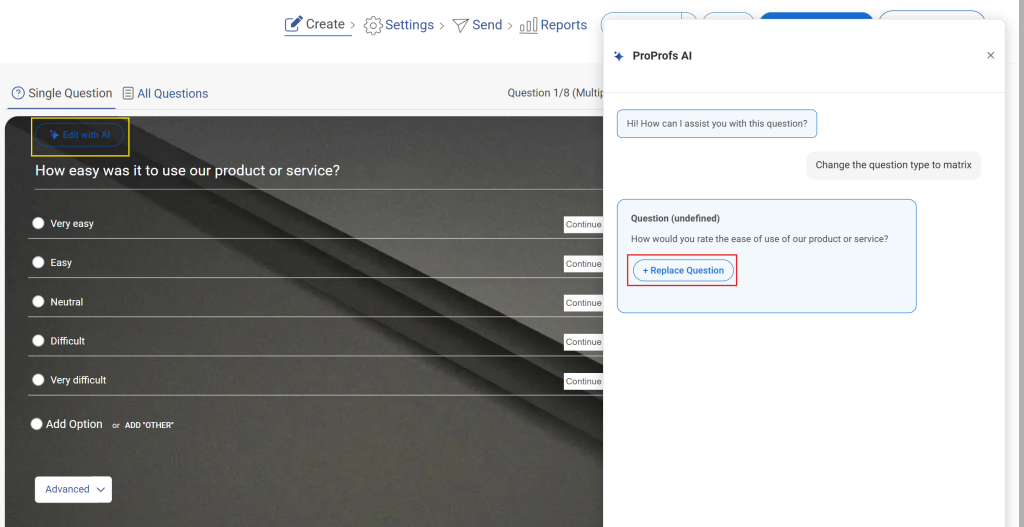
6. Edit each row so it asks one clear thing in plain language.
This approach is especially useful if you run surveys regularly but aren’t trained as a survey designer.
3. Pick One Scale and Label Every Point
One scale. Entire matrix. No exceptions.
If respondents interpret scale points differently, your averages become meaningless.
How to set the scale in ProProfs Survey Maker:
- Add or edit a Matrix Question.
- Under Columns, define your scale (e.g., 1–5).
- Label each point clearly, such as:
- 1 – Very Dissatisfied
- 2 – Dissatisfied
- 3 – Neutral
- 4 – Satisfied
- 5 – Very Satisfied
- Apply the same scale to every row in the matrix.
When midpoints are unlabeled, one person’s “3” means neutral and another’s means slightly positive. That ambiguity compounds across hundreds of responses into averages that don’t reflect reality.
4. Keep One Theme Per Matrix
Every question in a matrix must belong to the same mental context.
Don’t mix service questions with product questions just because they share a scale.
Example structure:
Matrix 1: Support Experience
Rows:
- The support team responded quickly
- My issue was resolved clearly
- The support representative was knowledgeable
Matrix 2: Product Experience
Rows:
- The product is easy to use
- The product meets my needs
- The product performs reliably
Respondents can’t hold two contexts simultaneously while selecting from one shared scale.
5. Write Like You’re Talking to Someone
Before sending the survey, read every question out loud.
If it sounds awkward when spoken, it will read the same way on screen.
Editing tips inside ProProfs Survey Maker:
Click each question in the survey editor. And ask AI to:
- Simplify wording directly in the question text field.
- Avoid jargon and internal terminology.
- Break any double-barreled rows into separate questions.
Bad row:
“How satisfied are you with the speed and accuracy of our support?”
Better rows:
- Our support team responded quickly
- The solution provided was accurate
Two questions = two rows.
What Type of Matrix Question Should You Use?
Most people overthink this. For customer satisfaction and product feedback, two types cover the majority of situations: the Likert scale and the rating scale. Here’s the full picture in one table so you can decide in 30 seconds and move on.
| What You're Measuring | Question Type to Use |
|---|---|
| Satisfaction, Attitude, or Agreement | Likert scale |
| Performance or Quality Scores | Rating scale |
| Which Attributes Apply | Multiple choice |
| What Matters Most | Ranking |
| Perception Between Two Extremes | Bipolar |
| The “Why” Behind a Rating | Open-text |
What Are Likert Scale Matrix Questions?
A Likert scale runs from “Strongly Disagree” to “Strongly Agree,” typically on five or seven points. Use it when you’re measuring how someone feels about an experience, a process, or a relationship.
It’s the right call for most CSAT and engagement surveys.
Here’s a ready-to-use website CSAT matrix survey you can copy right now:
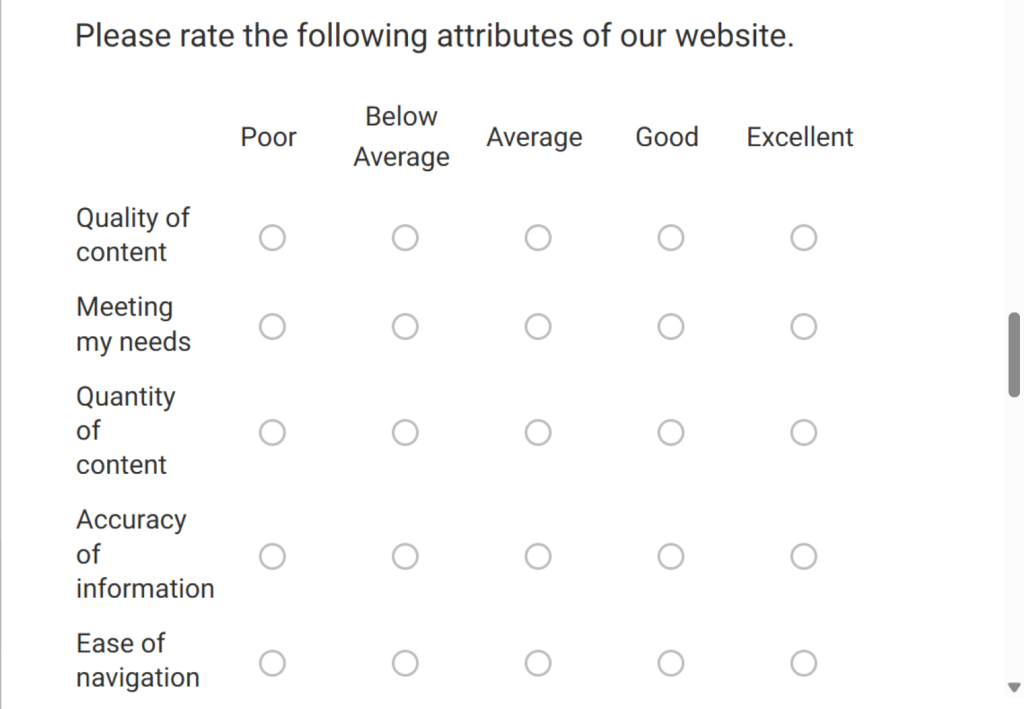
Edit the statements for your context and you have a working CSAT matrix in five minutes.
One practical note: five-point Likert scales outperform seven-point on mobile. Fewer columns, less scrolling, more completions.
What Are Rating Scale Matrix Questions?
A rating scale uses numbers, usually 1 to 5 or 1 to 10, to score each item. Use it when you need a performance number you can average, rank, and benchmark over time.
This is the right format for product feedback, service quality benchmarking, and 360 assessments.
Here’s a ready-to-use product feedback matrix survey, but more engaging with emoticons:

Keep the same scale across every row. The moment you mix 1 to 5 on one row and 1 to 10 on the next, your data stops being comparable.
What Are the Other Four Types?
Multiple-choice matrix: Respondents pick one or more column options per row. Best for feature comparisons and attribute research. Cap at four columns. Beyond that, people stop reading and start clicking.
Ranking matrix: Respondents order items by preference or priority. Use this when you need to know what matters most, not just whether it matters.
Bipolar matrix: Two opposites anchor each end, like “Too Cheap” versus “Too Expensive.” Best for brand perception and positioning research.
Open-text matrix: Adds a text field to each row so respondents can explain their rating. Genuinely useful in 360-degree feedback. Limit yourself to one open-text row per matrix. More than that and completions drop sharply.
What Are the Risks of Matrix Surveys and How Do You Handle Them?
Three things will quietly kill your data quality if you don’t design against them from the start.
1. Straight-Lining
This is when a respondent clicks the same column for every row without reading. They just want to finish. You end up with clean-looking data that’s completely useless.
It’s the most common quality problem in matrix surveys and one of the hardest to catch after the fact.
Here’s how to prevent it:
- Add a reverse-coded item, a negative statement inside an otherwise positive set. A straight-liner won’t adjust for it and their response flags itself.
- Drop in an attention-check row with this exact language: “We want to make sure responses are accurate. Please select ‘Agree’ for this item.” Copy that line directly into your survey.
- Keep your matrix short. Most straight-lining happens when respondents feel overwhelmed. Five rows maximum removes most of the motivation to rush.
2. Overloaded Grids
More rows and columns don’t mean more insight. They mean worse data.
Research found that 5 rows by 5 columns is the point where quality and completion are both high. Here’s what happens as you go beyond it:
| Matrix Size | Experience | Data Quality |
|---|---|---|
| 3 rows x 4 columns | Fast, comfortable | High |
| 5 rows x 5 columns | Optimal balance | High |
| 7 rows x 6 columns | Starting to feel heavy | Moderate |
| 10 or more rows x 7 or more columns | Overwhelming | Low |
One matrix per page. Five rows maximum. Five to six columns maximum. If you have more questions than that, split them into a second matrix under a new theme heading.
3. Mixed Topics in One Grid
Putting unrelated questions into one matrix because they share a scale is a design shortcut that hurts your data. Respondents can’t hold two different mental frames while selecting from the same scale, and the responses reflect that confusion. One theme per matrix, no exceptions.
FREE. All Features. FOREVER!
Try our Forever FREE account with all premium features!
What Should You Look for in a Matrix Survey Tool?
When you’re evaluating survey platforms, here’s what actually matters for matrix surveys specifically:
- Mobile-Responsive Rendering: the matrix should auto-adapt to small screens without you having to manually reformat anything
- Pre-Built Templates: starting from a proven structure saves time and reduces the kind of design errors that only show up in your data
- Scale Consistency Controls: easy to set and lock one scale across all rows in a matrix
- Auto-Scoring and Section Averages: results should flow into scores automatically, not into a spreadsheet you have to process manually
- Visual Reporting Dashboards: output should be shareable directly with stakeholders as charts, not raw exports
- AI-Assisted Question Generation: matters for teams running multiple surveys per quarter without a dedicated survey designer
- WCAG 2.1 AA Accessibility: non-negotiable for education, healthcare, and government contexts
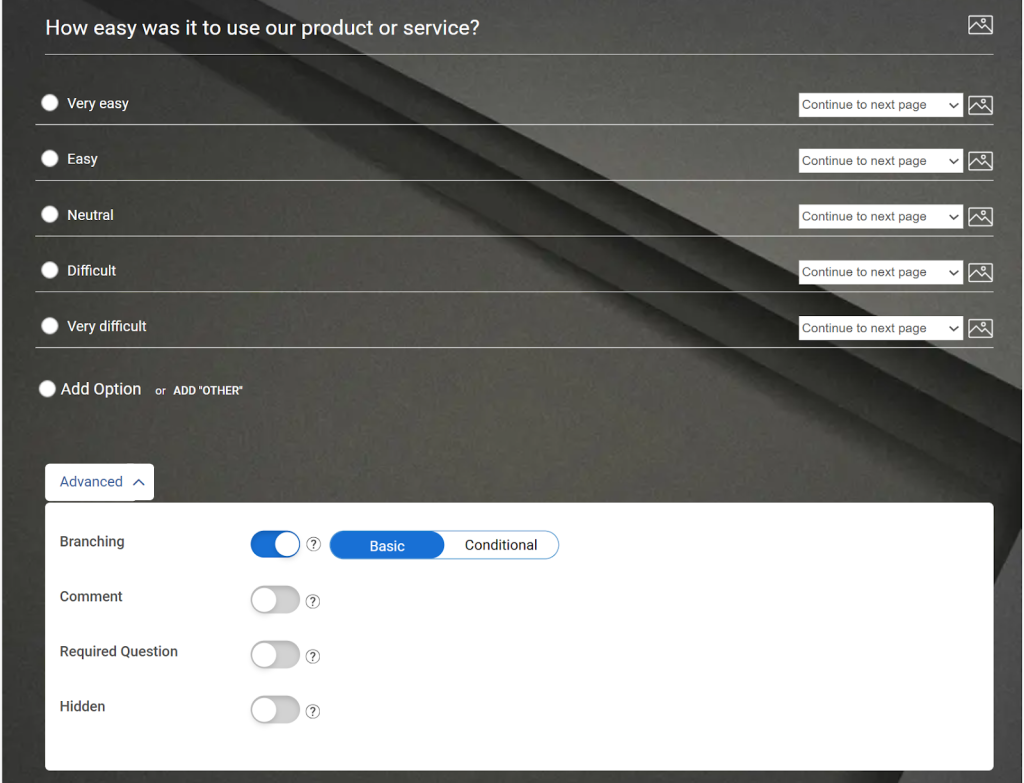
- Branching and Skip Logic: lets you show or hide questions based on prior answers, which keeps surveys relevant and completion rates high
A tool like ProProfs Survey Maker covers all of these. The auto-scoring and dashboard features specifically make the difference between a survey that produces a report and one that produces a spreadsheet someone has to clean up before it’s useful.
How Does a Monthly Matrix Survey Actually Work? A Real Example
Tutt Land Company is a full-service real estate and land management firm operating across Alabama, Georgia, Tennessee, and Mississippi. They work with buyers and sellers of rural properties and need a consistent way to track how customers feel after each transaction.
Their problem was straightforward. They wanted to improve their marketing strategies, customer service processes, and agent performance. But they had no structured feedback coming in, and most survey tools they looked at were either too expensive or too complicated for their team to use consistently.
They chose ProProfs Survey Maker and set up a survey sent to every customer who completed a transaction, once a month.
Here’s the complete success story:
Here is how a matrix survey for their use case would be structured, using the same format described in this guide.
Matrix 1: Agent Performance
| Statement | Strongly Disagree | Disagree | Neutral | Agree | Strongly Agree |
|---|---|---|---|---|---|
| My agent understood what I was looking for | [ ] | [ ] | [ ] | [ ] | [ ] |
| My agent communicated clearly throughout the process | [ ] | [ ] | [ ] | [ ] | [ ] |
| My agent was responsive when I had questions | [ ] | [ ] | [ ] | [ ] | [ ] |
| My agent made the process feel straightforward | [ ] | [ ] | [ ] | [ ] | [ ] |
Matrix 2: Overall Experience
| Statement | Strongly Disagree | Disagree | Neutral | Agree | Strongly Agree |
|---|---|---|---|---|---|
| The transaction process met my expectations | [ ] | [ ] | [ ] | [ ] | [ ] |
| I was kept informed at each stage | [ ] | [ ] | [ ] | [ ] | [ ] |
| Any issues I encountered were handled well | [ ] | [ ] | [ ] | [ ] | [ ] |
| I would work with this company again | [ ] | [ ] | [ ] | [ ] | [ ] |
Two matrices. Eight questions total. One theme per grid. Consistent five-point scale throughout.
The output is section-level averages per agent and per experience category, tracked month over month. You can see exactly where performance is improving and where it isn’t, without anyone manually processing a spreadsheet.
That is what a well-designed matrix survey system looks like when it’s actually running.
How Do You Make a Matrix Survey Work on Mobile?
90% of adults now access surveys on smartphones. Most matrix surveys are not built for that.
Traditional horizontal grids require horizontal scrolling on mobile, have tap targets that are too small to select accurately, and suffer from visible-column bias, where respondents only click options they can see without scrolling, skewing your data toward the left side of the scale before you’ve analyzed a single response.
Here’s what to do differently:
1. Cap at four columns. Five-column matrices require horizontal scrolling on most phones. If your scale needs five points, label only the endpoints and number the middle options to keep column width down.
2. Use short labels. “Strongly Agree” becomes “St. Agree” or a numbered midpoint with labeled ends. Every extra character risks text wrapping and broken layouts on smaller screens.
3. Keep it to three or four rows for mobile-first surveys. If your analytics show most respondents are on phones, design for mobile first and scale up for desktop, not the other way around.
4. Test on an actual device. Not a browser resize. A real phone with a 390px screen width. Desktop previews hide the problems that kill mobile completion rates.
Tools like ProProfs Survey Maker auto-optimize matrix layouts for mobile screens, which removes the need to manually test and reformat across devices. That matters when surveys go to large or distributed audiences, and you can’t control what device people use.
Ready to Build Your Matrix Survey?
You have the format, the question sets, the decision table, and a real example of how it runs in practice.
The next step is to see the full workflow end-to-end. If you’re running matrix surveys for CSAT, product feedback, or any evaluation-based survey at scale, a tool like ProProfs Survey Maker is your one-stop solution.
Frequently Asked Questions
What are the benefits of using a matrix survey?
The main benefit is more data with less respondent effort. Grouping related questions under a shared scale cuts completion time significantly, and shorter surveys get more responses. The consistent format also makes it easier to compare scores across attributes and generate automated reports without manual work.
How many questions should a matrix survey have?
5 rows by 5 columns is the optimal size. Beyond five rows, drop-off rates climb. Beyond five to six columns, respondents start disengaging or straight-lining. For mobile-first surveys, three to four rows and four columns is the safer ceiling.
What is straight-lining, and how do I stop it?
Straight-lining is when a respondent clicks the same column for every row without reading, just to finish faster. Add a reverse-coded item, an attention-check row, or a honeypot question to catch it. Keeping your matrix short is the simplest prevention of all.
When should I use a matrix survey instead of individual questions?
Use a matrix when your questions share the same scale, cover a single theme, and you need comparable scores across items. Use individual questions when topics differ, when you need rich qualitative responses, or when accessibility compliance is required. Most well-designed surveys use both: matrix sections for structured data, individual open-ended questions for qualitative follow-up.
How do I analyze matrix survey results?
Calculate section-level averages and track them over time. A single survey snapshot tells you where things stand today. Running the same matrix monthly or quarterly tells you whether they're improving. Pair your scores with visual dashboards and share them in a format stakeholders can act on, not a raw data export they have to process first.
Are matrix surveys accessible for visually impaired users?
Standard matrix grids can cause problems for screen readers, which sometimes fail to read row headings correctly. WCAG 2.1 AA compliance is now required in many government, healthcare, and education contexts. If accessibility is a requirement, use repeated single-answer questions as the safer alternative and verify your survey platform supports accessible matrix HTML by default.
How do I make a matrix survey mobile-friendly?
Keep it to four columns, use short labels, limit rows to three or four for mobile-first audiences, and test on an actual phone before publishing. Browser resize previews don't show you what a real mobile user sees. Design for the smallest screen first, then expand for desktop.
FREE. All Features. FOREVER!
Try our Forever FREE account with all premium features!
 We'd love your feedback!
What did you like & how can we make it even better?

 Thanks for your feedback!
 Ask Your Question
Have a question? Get expert help to make your decision easier.