ProProfs Survey Maker Editorial Team is a diverse group of professionals passionate about survey creation and market research. We update you on the latest trends, dive into technical topics, and offer insights to elevate your business.
Matrix survey questions look simple to write and hard to get right. You bundle five or six related items under one scale, save space, and assume you’re done.
Then completion rates drop, or half your responses look identical down every row, which usually means people stopped reading and started clicking.
That’s a survey design problem, not a format problem.
A well-built matrix question, the kind you’d set up with row and column controls that hold the scale steady, still needs the same discipline behind it: short rows, one theme per grid, and a mobile-tested layout.
Below are matrix survey question examples you can copy directly, the types worth knowing, and the mistakes that quietly wreck the data even when the questions look fine on a desktop screen.
What Is a Matrix Survey Question?
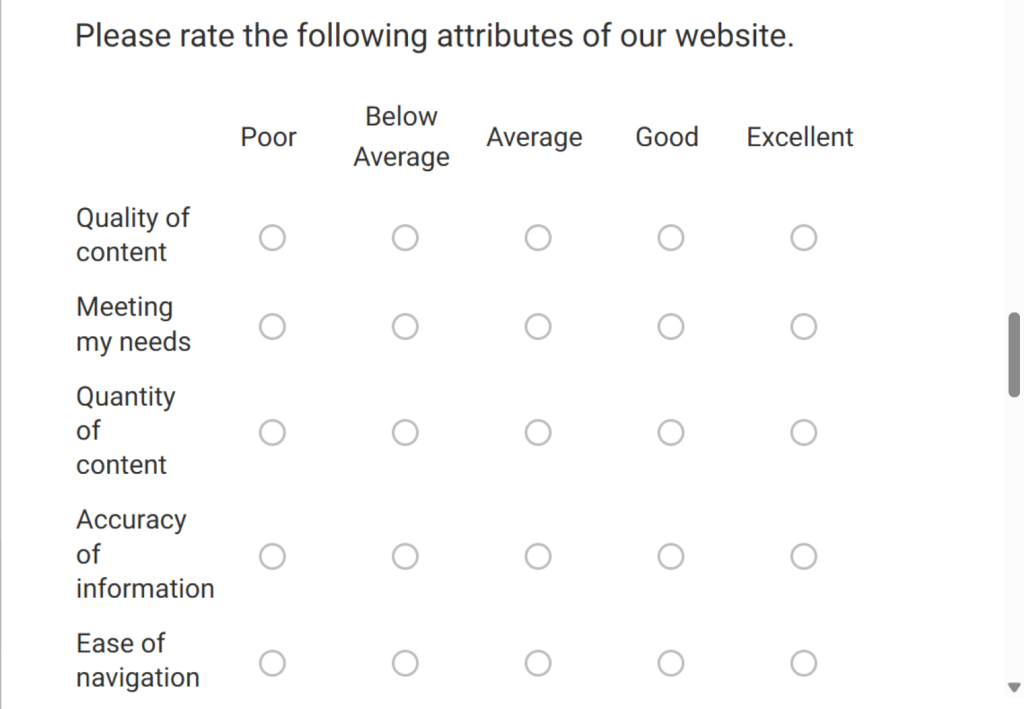
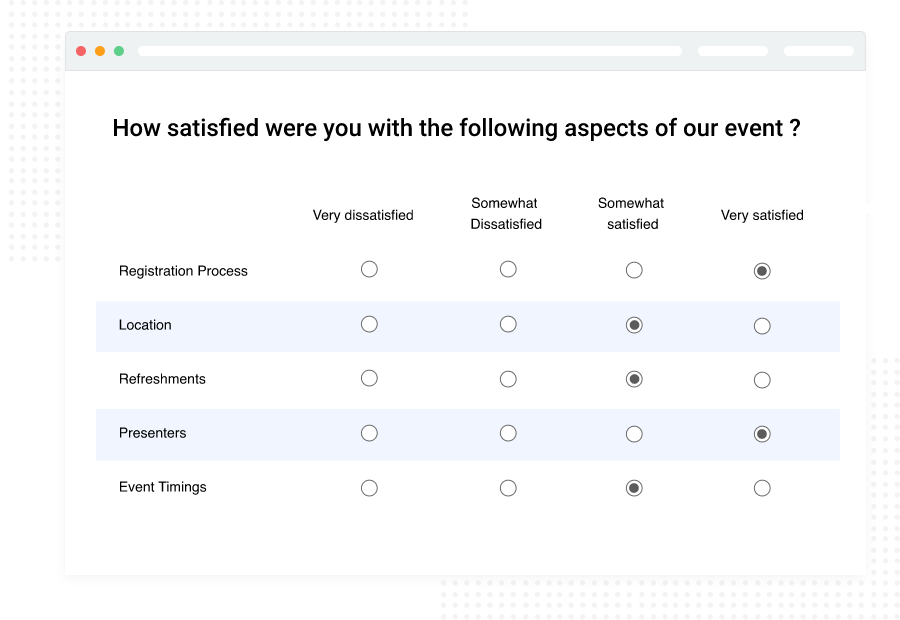
A matrix survey question, also called a grid or table question, presents several related statements as rows and a single shared rating scale as columns. Respondents rate each row using the same scale, turning five or more separate questions into a single compact table.
It only works when every item you’re asking about genuinely deserves the same rating criteria. The moment one row needs a different scale, the format starts working against you instead of for you.
Matrix questions aren’t a scale type on their own. They’re a container.
Inside that container, you’re usually running a Likert scale, a satisfaction scale, a frequency scale, or a simple yes/no grid across several statements at once.
Confusing the container with the scale is where many poorly built matrices start.
Here’s a quick way to test whether your list of items actually belongs in one matrix: write out the question stem once, then read each row after it out loud.
“Please rate the following: I understand what is expected of me at work.”
If that sentence makes sense for every row using the same five-point scale, you’ve got a valid matrix. If you have to mentally swap the scale for even one row, split it out.
ProProfs Survey AI Coach
Ask anything about surveys, feedback, and user insights
","text/html");
function clean(node){
if(node.nodeType===3){var t=node.textContent.replace(/\s+/g," ").trim();return t?t:"";}
if(node.nodeType!==1)return "";
var tag=node.tagName;
if(!allowed[tag])return Array.prototype.map.call(node.childNodes,clean).join("");
if(tag==="BR")return " ";
var inner=Array.prototype.map.call(node.childNodes,clean).join("");
if(tag==="A"){
var href=(node.getAttribute("href")||"").trim();
if(!/^https?:\/\//i.test(href))return inner;
return ''+inner+"";
}
return "<"+tag.toLowerCase()+">"+inner+"";
}
return Array.prototype.map.call(doc.body.childNodes,clean).join("");
}
function addBot(html,stacked){var r=document.createElement("div");r.className="proprofs_ai_chat__row";r.innerHTML='
'+(stacked?'':'')+'
'+linkify(html)+'
';scroll.appendChild(r);scrollToBottom();}
function addUser(t){var r=document.createElement("div");r.className="proprofs_ai_chat__row proprofs_ai_chat__row--user";var b=document.createElement("div");b.className="proprofs_ai_chat__user-bubble";b.textContent=t;r.appendChild(b);scroll.appendChild(r);scrollToBottom();}
function addCrisis(){var r=document.createElement("div");r.className="proprofs_ai_chat__row";r.innerHTML='
';scroll.appendChild(r);scrollToBottom();}
function typingOff(){var t=document.getElementById("proprofs_ai_chat_typing");if(t)t.remove();}
function typingOn(){typingOff();var r=document.createElement("div");r.className="proprofs_ai_chat__row";r.id="proprofs_ai_chat_typing";r.innerHTML='
';scroll.appendChild(r);scrollToBottom();}
function respond(text,questionType){
questionType=(questionType===1)?1:0;
startAiChatDurationTimer();
if(crisisLatch||hitsTripwire(text)){
crisisLatch=true;
addCrisis();
saveChatTurn(text,CRISIS.title+" "+CRISIS.body.replace(/<[^>]+>/g," "),true,questionType);
return;
}
busy=true;sendBtn.disabled=true;typingOn();
history.push({role:"user",content:text});
fetch(PROXY_URL,{
method:"POST",headers:{"Content-Type":"application/json"},
body:JSON.stringify({messages:history,articleTitle:ARTICLE_TITLE,artile_description:artile_description,coachName:"ProProfs Survey AI Coach"})
}).then(function(r){return r.json();}).then(function(data){
typingOff();
var reply=(data&&data.reply)?data.reply:"Sorry, something went wrong. Please try again.";
history.push({role:"assistant",content:reply});
saveChatTurn(text,reply,false,questionType);
var chunks=reply.split(/\n\s*\n/).map(function(c){return c.trim();}).filter(Boolean);
if(chunks.length===0){busy=false;sendBtn.disabled=false;return;}
var delay=0;
chunks.forEach(function(chunk,idx){
setTimeout(function(){
typingOff();
addBot(sanitizeHtml(chunk),idx>0);
if(idxYou could start with';
STARTERS.forEach(function(q){var b=document.createElement("button");b.className="proprofs_ai_chat__starter";b.textContent=q;b.addEventListener("click",function(){send(q,1);});st.appendChild(b);});
scroll.appendChild(st);
})();
What Are the Main Types of Matrix Survey Questions?
Matrix questions aren’t one-size-fits-all. Six variations cover almost every use case, and picking the wrong one is usually why a grid feels harder to answer than it should.
Matrix Type
How It Works
Best For
Single-Select
One answer per row
Standard rating grids like CSAT or engagement
Multi-Select
Multiple answers allowed per row
Feature usage or channel preference questions
Dropdown
Each row uses a dropdown instead of visible columns
Grids with too many columns to display cleanly
Ranking
Respondents rank items instead of rating them
Prioritization exercises, feature requests
Constant Sum
Respondents distribute a fixed number of points across rows
Budget allocation, importance weighting
Text Entry
Each row has a text box instead of a scale
Collecting specific comments per item
Each type solves a different problem. Here’s when to reach for each one:
Single-Select
The default choice, and the fastest to answer and analyze since every response is one fixed value you can average, chart, or export straight into a pivot table.
Use it for satisfaction, agreement, or frequency ratings, which cover most CSAT and engagement surveys.
Multi-Select
Use it when more than one answer is genuinely true for a row.
“Which of these support channels have you used for X” needs a multi-select, since someone might use email and live chat for billing but only phone for technical issues.
Forcing single-select here throws away real data.
Ranking
Use it for relative priority instead of an absolute score. Rating five features on a 1-to-5 scale can leave everything rated a 4.
Ranking forces respondents to put one item above another instead of calling everything equally important.
Constant Sum
Use it to force quantified trade-offs. Give respondents 100 points to split across five features based on where they want your team to focus.
Every point on one row has to come from another, producing a real distribution instead of five inflated ratings. Best for roadmap input or budget allocation.
Dropdown
Use it to solve the mobile and column-count problem.
If you need seven or more response options per row, a dropdown collapses the grid’s visible width to almost nothing, at the cost of one extra tap per row.
Text Entry
Use it when you need an exact number or a comment per row instead of a rating.
“Enter the number of hours spent on each task last week” needs text entry, not a bucketed scale.
Weighted Scoring
Assign a numeric value to each column in a single-select or multi-select matrix, for example, Strongly Agree as 5, Neutral as 3, Strongly Disagree as 1.
The platform automatically totals or averages the score per respondent.
A four-row engagement matrix scored this way gives each person a composite score from 4 to 20, turning the matrix into a scored assessment instead of just a satisfaction snapshot.
That distinction matters for HR maturity assessments or lead qualification surveys.
This is a five-point scale on purpose. Anything past five columns, and respondents start losing track of what the third or fourth option actually means relative to the others.
If you’re tempted to add a sixth column like “N/A,” don’t fold it into the scale. Add it as a separate checkbox above the grid instead, so it doesn’t distort your averages.
Each of these examples passes the same test before a row gets added: can this item honestly be judged on the exact same scale as every other row in the grid?
If the answer is no, it belongs in a separate matrix or a standalone question.
Run every new row you write through that same check before it goes live, not after you’ve collected a week of responses and noticed the data looks off.
How Do You Create a Matrix Survey Question in ProProfs Survey Maker?
You can build this manually from a blank grid, start from a template, or let AI generate the whole thing from a prompt or an uploaded document. Here’s how:
The 4 steps below cover all the paths, so follow the branch that matches how you’re starting.
Step 1: Start a New Survey
From your dashboard, select Create a Survey. If your matrix fits an existing use case, like CSAT or employee engagement, start with the template from the library instead of a blank page.
The rows and scale are usually already structured correctly, which saves you from rebuilding a grid you’ve built before.
If nothing in the library matches your topic, use the AI Survey Maker instead of starting from a blank page.
Describe your survey goal in a prompt, like “Create a 4-question employee engagement matrix survey rating agreement on a 5-point scale from Strongly Disagree to Strongly Agree, covering role clarity, manager feedback, access to tools, and growth opportunities.”
Try it here:
Let ProProfs AI Build a Survey
Describe your survey and we'll create it for you
Or, upload an existing PDF, DOCX, or TXT file, such as an onboarding checklist, course syllabus, or assessment framework, and the AI will read it and generate a full matrix-ready question set from it in seconds.
Step 2: Edit Your Row Statements
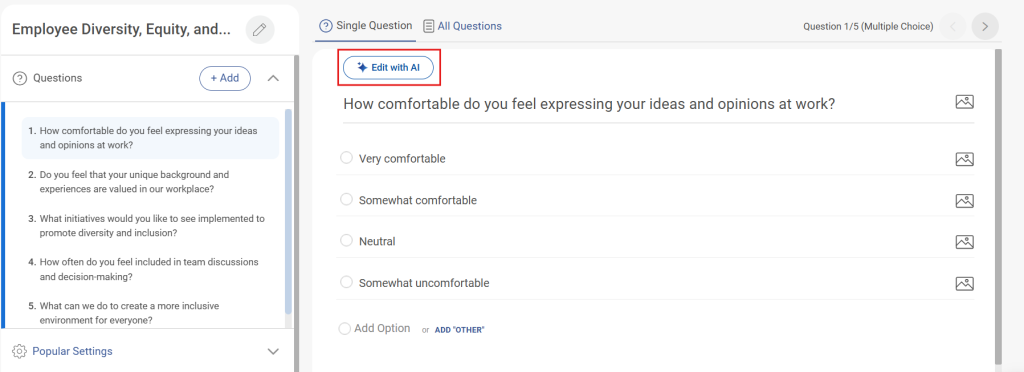
Read through each one instead of typing from scratch: edit them using the “Edit with AI” functionality.
Keep every statement to 10 words or fewer and limited to one idea.
If a row needs “and” to make sense, like “affordable and easy to use,” that’s actually two rows, not one, so split it before you move on to the next step.
Step 3: Preview the Layout on Mobile
Use the built-in device preview to check how the grid stacks on a smaller screen before publishing.
On mobile, a well-built matrix should reflow into one statement at a time with the full scale still visible underneath it, not shrink the whole table down to fit the width.
If you see labels getting cut off or the grid forcing a horizontal scroll, go back and shorten your column labels or row statements before you send the survey out.
Step 4: Publish and Share the Survey
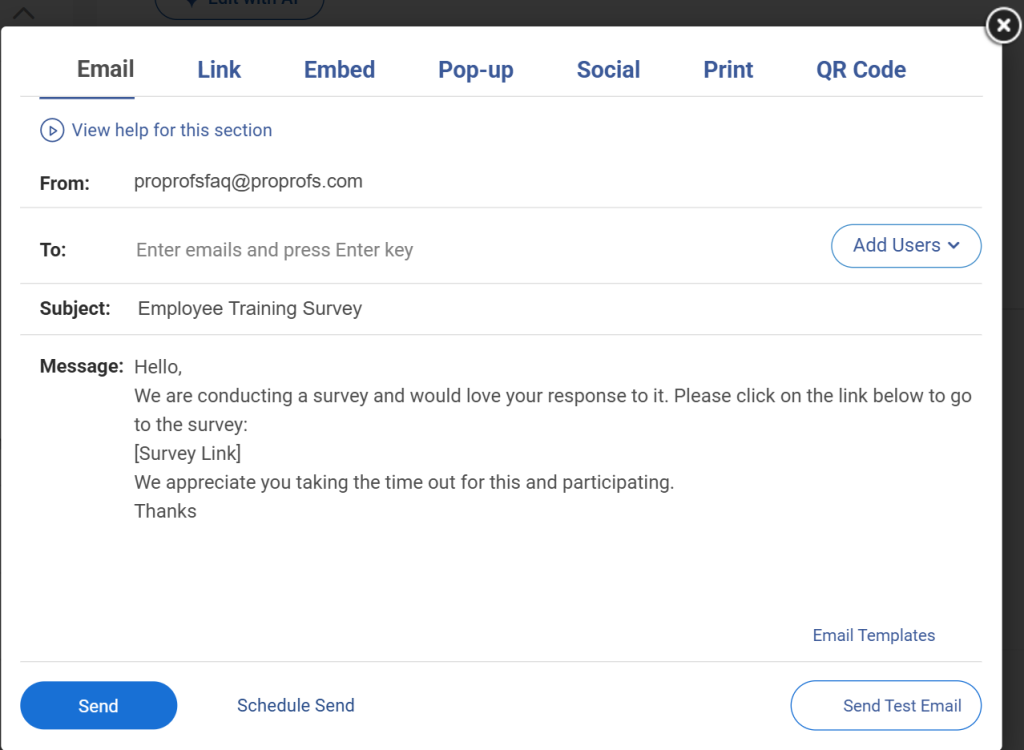
Distribute the survey by email, direct link, QR code, or website embed, and monitor responses from the real-time reporting dashboard as they come in.
Check the first ten or so responses within the first hour of launch, specifically for straightlining, meaning every row rated identically by the same respondent, so you can catch and fix a confusing row before it affects your whole sample.
FREE. All Features. FOREVER!
Try our Forever FREE account with all premium features!
The matrix format isn’t what causes bad data. These five habits are, and each one has a specific fix you can apply before your next send, not after the responses come back looking strange.
Long Grids Increase Straightlining, So Cap Rows at Five
Once a grid passes five to seven rows, respondents start picking one column and repeating it down the page without reading each statement.
If you have more than seven related items, don’t cut content to force it under the limit.
Split them into two smaller matrices grouped by subtopic instead, so a ten-item engagement survey becomes two clean five-row grids rather than one long one.
Mixed Topics Confuse the Scale, So Keep One Theme per Matrix
If half your rows are about product quality and the other half are about support speed, respondents can’t judge them with the same yardstick, and the average score across the grid loses any specific meaning.
Before finalizing a matrix, group your draft rows by theme on paper first.
If you end up with two clear clusters, that’s your signal to build two matrices, each labeled with its own question stem, instead of one long grid, and start a second matrix for the second theme.
Double-Barreled Rows Skew Ratings, So Split Compound Statements
A row like “The product is affordable and easy to use” asks two questions at once.
A respondent who finds it affordable but hard to use has no honest way to answer, so they either default to the middle option or answer based on whichever half feels more important to them at that moment, and you have no way to tell which.
Split it into two rows instead: “The product is affordable” and “The product is easy to use,” so the rating reflects one idea, not an unspoken average of two.
Unoptimized Mobile Layouts Break Completion, So Test before You Send
A five-column, seven-row matrix needs real horizontal space to display cleanly, roughly the width of a desktop browser window.
On a phone screen, that same grid forces sideways scrolling or shrinks column labels to the point of unreadability.
Since most survey traffic now comes from mobile devices, this is the single biggest reason matrix questions are abandoned mid-survey.
Before you send a single response request, open the survey link on your own phone, not just the platform’s preview mode, and answer it yourself the way a respondent would.
A platform that stacks the grid into a scrollable, single-column view on smaller screens, which is how ProProfs Survey Maker’s matrix question type behaves by default, removes this failure point without you having to redesign anything.
Positive-Only Wording Hides Straightlining, So Add a Reverse-Coded Row
If every statement in your grid is worded positively, a respondent who’s straightlining looks identical to one who genuinely agrees with everything, and you’ll have no way to separate real signal from noise in your export.
Word one item in the opposite direction, for example, “My workload is manageable” alongside otherwise positive statements like “I have the tools I need to do my job well.”
When you review the data, flag any respondent who rated both the positive and reverse-coded items identically.
That’s your practical signal that the response set is unreliable and should be excluded from your averages.
AI Defaults Can Miss Your Scale, So Verify before You Publish
If you generated your matrix with AI, check that the scale it sets matches what you need, rather than assuming it’s correct.
AI tools often default to a generic five-point scale that’s close but not exact for your use case, such as a satisfaction scale where you actually needed an agreement scale.
This scale applies across every row in the grid, so a mismatch here quietly skews every single response you collect until you catch it.
Wrong Answer Mode Skews Averages, So Match It to the Question
Decide deliberately whether respondents can select one response per row or several, rather than leaving the answer type toggle on whatever it defaulted to.
Most satisfaction and agreement grids should stay on single-answer, since that’s what keeps the averages meaningful.
Multiple-answer mode belongs on questions like “which of these channels have you used,” where more than one selection per row is genuinely correct.
Mixing the two up either forces an artificial single choice where several are true, or muddies your averages with multiple selections where you needed one clean rating.
What Should You Do Next?
Every example above works because it respects the same handful of rules: one theme, one scale, five rows or fewer, and a layout that survives a phone screen.
Get those right, and the format does exactly what it’s supposed to: collect more signal in less space without asking more of the respondent.
Get started with ProProfs Survey Maker and turn one of the examples above into a live survey in minutes.
If you’re still comparing question formats for your next survey, browse the full template library to find the structure that fits your use case.
All of this is available on ProProfs Survey Maker’s free plan, so there’s nothing stopping you from testing a matrix question today.
Frequently Asked Questions
When should you use matrix-style survey questions?
Use matrix-style survey questions when several related items genuinely share one rating scale, such as employee engagement dimensions or CSAT touchpoints rated the same way. If your team keeps rebuilding the same block of standalone questions across surveys, that repetition is usually the clearest sign that a matrix format fits better and saves setup time.
Is a matrix question the same as a grid question?
Yes, a matrix question, a grid question, and a table question all describe the same format: rows of related statements rated against a shared set of columns. The terminology differs by platform and research background, but the mechanics stay identical. If a tool calls it a grid question instead, you're building the same structure.
How many rows should a matrix survey question have?
Lensym’s 2026 best practice research recommends capping matrix grids at 5–7 rows. Beyond this threshold, straightlining (repetitive column selection without reading) and dropout rates increase substantially. A 5x5 matrix is often cited as a strong balance for data quality.
Is a matrix question the same as a Likert scale?
Not exactly, though the two get confused often. A Likert scale is a specific rating method measuring agreement or frequency. A matrix question is the grid layout that can hold a Likert scale, a satisfaction scale, or another rating system across rows. Every Likert matrix is a matrix question, but not every matrix question uses a Likert scale.
Do matrix questions work well on mobile devices?
Only if the survey tool stacks the grid into a scrollable, single-column view instead of forcing the full table into a narrow screen. A matrix built for desktop width, with five or more columns, usually breaks on a phone and forces respondents to pinch, zoom, or scroll sideways. Always preview on mobile before sending.
Can matrix survey responses be scored?
Yes, each column in a matrix question can carry a numeric point value, letting the survey tool calculate an average or total score per respondent across every row. This is how matrix questions get used in scored assessments, coaching worksheets, and lead qualification, rather than only in simple satisfaction surveys.
What's the biggest cause of bad matrix survey data?
Straightlining is the biggest cause, where respondents select the same column down every row without actually reading each statement, usually because the grid is too long or the rows feel repetitive. Shorter grids, single-theme matrices, and at least one reverse-worded row all help you catch this pattern during survey analysis instead of mistaking it for genuine agreement across the board.
Can I add skip logic to a matrix question?
Yes, most modern survey builders, including ProProfs Survey Maker, support branching logic based on how a respondent answers specific rows within a matrix question. This lets you route respondents to a follow-up question only if they rated a particular row poorly, which is useful for isolating problem areas without lengthening the survey for people who rated everything favorably.
Let ProProfs AI Build a Survey
Describe your survey and we'll create it for you
FREE. All Features. FOREVER!
Try our Forever FREE account with all premium features!
ProProfs Survey Maker Editorial Team is a passionate group of seasoned researchers and data management experts dedicated to delivering top-notch content. We stay ahead of the curve on trends, tackle technical hurdles, and provide practical tips to boost your business. With our commitment to quality and integrity, you can be confident you're getting the most reliable resources to enhance your survey creation and administration initiatives.







 We'd love your feedback!
 Thanks for your feedback!