Customer satisfaction score (CSAT) is supposed to be the easy one. Ask a quick question, get a number, move on. In real life, it rarely stays that clean.
I have watched teams collect CSAT for months, stare at a 4.3 or an 86 percent, and still argue about what it means.
- Is that actually good for our space?
- Did we improve, or did fewer people just bother to respond?
- And what do we change on Monday morning because of it?
This guide is how I make CSAT useful again. We will cover what CSAT measures, how to calculate it with simple examples, what “good” looks like with benchmarks, and how to turn the score into action across support, product, and retention.
What Customer Satisfaction Score Measures & How CSAT Surveys Work
Customer satisfaction score measures one simple thing: how a customer feels about a specific interaction they just had with your business.
That detail matters more than most teams realize.
CSAT is not a loyalty metric. It does not tell you whether someone will stay with you long term or recommend you to a friend. It tells you whether a moment in the journey met expectations.
Think support resolution, onboarding step, checkout experience, or delivery confirmation.
This is why CSAT works best when it is transactional and timely.
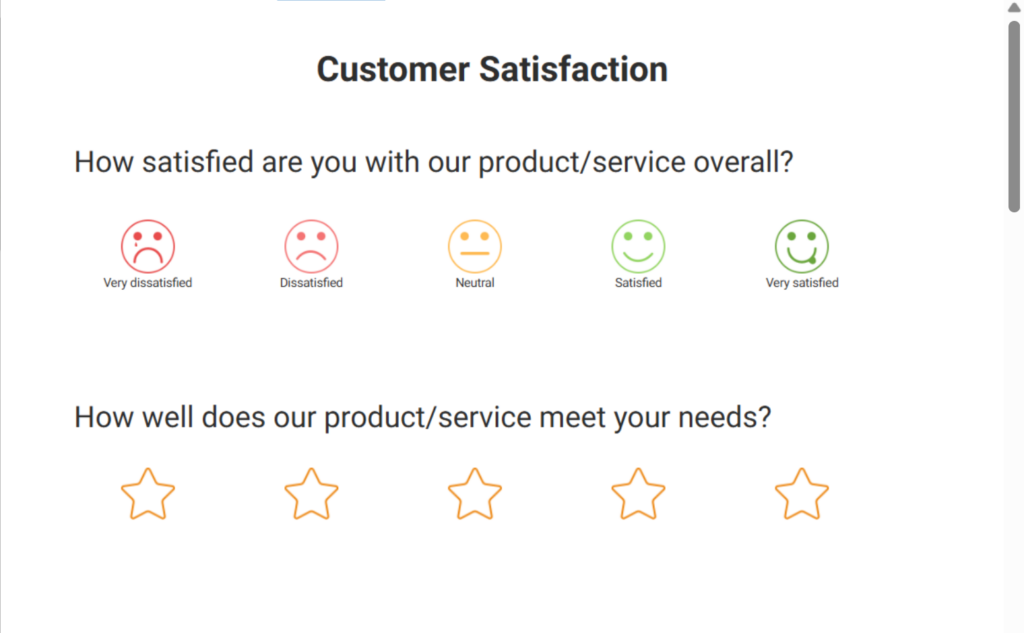
A typical CSAT survey asks a direct question like:
“How satisfied were you with your experience?”
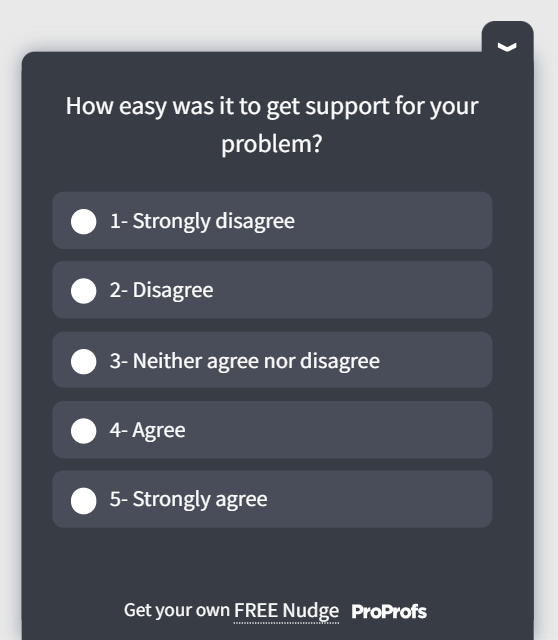
The customer responds using a structured rating scale. The most common formats are:
- 1–5 scale, where 1 means very dissatisfied and 5 means very satisfied
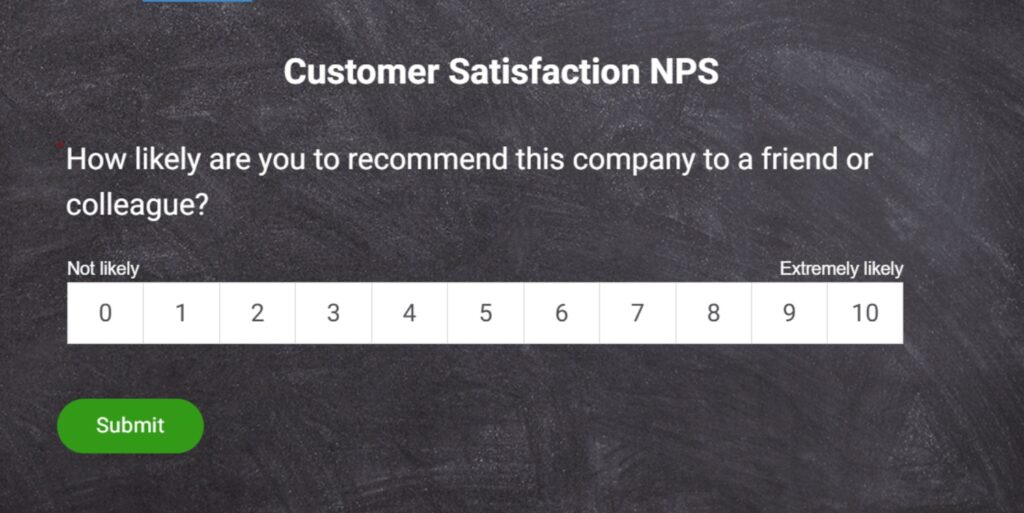
- 0–10 scale, often used when teams want more granularity
- Stars or emojis, usually for high-volume, low-friction touchpoints
The scale itself matters less than consistency. What matters is that customers understand the scale instantly and can answer without thinking too hard.
Where CSAT surveys often go wrong is timing.
If you send a CSAT survey too early, before the customer has experienced value, you are measuring anticipation, not satisfaction.
If you send it too late, memory fades, and responses drop. The sweet spot is right after the interaction ends, while the experience is still fresh.
Another important point: CSAT is a snapshot, not a verdict.
A low score does not always mean your product is bad. It may point to friction in one step of the journey.
A high score does not mean customers are loyal or effort-free. It only means that, in that moment, expectations were met or exceeded.
When you treat CSAT as a focused pulse check instead of a broad judgment, it becomes much easier to trust the data and use it well.
How to Calculate Customer Satisfaction Score Step by Step
Calculating the customer satisfaction score is simple. The confusion usually comes from how teams interpret the number, not how they calculate it.
There are two common ways to calculate CSAT. Both are valid. The key is to pick one method and stick with it.
Method 1: Average CSAT Score
This is the most straightforward approach.
Let’s say you send a CSAT survey with a 1–5 scale and receive 10 responses:
- 2 customers rate the experience a 5
- 4 customers rate it a 4
- 3 customers rate it a 3
- 1 customer rates it a 2
To calculate the average:
- Add all the scores: (2×5) + (4×4) + (3×3) + (1×2) = 37
- Divide by the number of responses: 37 ÷ 10 = 3.7
Your CSAT score is 3.7 out of 5.
This method is easy to understand and works well for internal tracking and trend analysis. The downside is that averages can hide polarization. A mix of very happy and very unhappy customers can still look “fine” on paper.
Method 2: Percentage of Satisfied Customers
This method focuses only on customers who are clearly satisfied.
Using the same 1–5 scale, most teams define:
- 4 and 5 as satisfied
- 1 to 3 as neutral or dissatisfied
From the example above:
- Satisfied responses: 2 (5s) + 4 (4s) = 6
- Total responses: 10
The formula looks like this:
(Number of satisfied responses ÷ Total responses) × 100
So the CSAT score is:
(6 ÷ 10) × 100 = 60 percent
This approach is better for benchmarking and external reporting because it is easier to compare across teams and time periods.
Which Method Should You Use?
- Use average CSAT when you want to track subtle changes over time
- Use percentage-based CSAT when you want a clear, comparable headline number
Whichever method you choose, apply it consistently. Changing calculation logic midstream is one of the fastest ways to lose trust in your CSAT data.
If you prefer a quick walkthrough, there’s also a short video below that shows how to measure CSAT customer satisfaction score step by step:
A Simple Framework to Turn CSAT Into Action
A customer satisfaction score by itself does not improve anything. What you do after collecting it is what makes the difference. I run CSAT through the same five-step loop every time. It works for a small team, and it still works at scale.
Step 1: Design the Survey With Intent
Start with one clear CSAT question tied to a specific interaction. Avoid stacking multiple rating questions together. Keep the scale consistent and always include a short, open-ended follow-up question asking why the customer chose that score.
You can use a tool like ProProfs Survey Maker to create an effective CSAT survey with AI. This is where most of the insight comes from.
Step 2: Launch It at the Right Moment
Send the survey immediately after the interaction ends. That might be when a support ticket is marked resolved, an onboarding milestone is completed, or an order is delivered. The closer you are to the moment, the more accurate the feedback.
For this, you can add a microsurvey to your app/website that pops up whenever the customer takes action. Here’s a video to help you create an in-context survey:
Limit frequency. Oversurveying trains customers to ignore you.
Step 3: Analyze Beyond the Average
Do not stop at the overall CSAT score. Break results down by touchpoint, team, issue type, or customer segment. Look at question-level patterns and recurring themes in comments. A stable average can hide real problems.
Trends matter more than one-off spikes.
Step 4: Act on the Biggest Friction Points
Use CSAT feedback to fix what slows customers down or creates confusion. Support teams see repeat issues. Product teams spot usability gaps. Retention teams identify early risk.
Small fixes here often deliver the biggest CSAT gains.
Step 5: Close the Loop With Customers
This is the step most teams skip, and it is the one that determines whether customers keep responding.
10 Customer Satisfaction Score Best Practices
If you want CSAT you can actually trust, best practices matter more than the formula. Most CSAT programs fail for predictable reasons: bad timing, unclear benchmarks, and questions that bias the score.
1. Define Your CSAT Rules Before You Launch
- Pick one scale (1–5 or 0–10) and stick to it
- Pick one calculation method (average or percent satisfied) and document it
- Decide what you will treat as healthy, warning, and urgent
- Do not change logic midstream unless you are willing to reset baselines
2. Use Benchmarks as Guardrails, Not Goals
CSAT varies by industry, touchpoint, and region. Use ranges to stay grounded, not to chase perfection.
- 1–5 scale (percent satisfied using 4 and 5)
- Below 70%: consistent issues
- 70% to 80%: acceptable, friction exists
- 80% to 90%: strong
- 90%+: excellent, validate for bias
- 0–10 scale (percent satisfied using 8 to 10)
- Below 75%: meaningful dissatisfaction
- 75% to 85%: healthy
- 85% to 92%: strong
- 92%+: validate for bias
Quick reality check: if your score looks “too perfect,” check for sampling bias or score coaching before you celebrate.
3. Benchmark by Touchpoint, Not One Blended Number
Track CSAT separately for:
- Support resolution
- Live chat
- Onboarding milestones
- Check out or purchase
- Delivery or completion
- Renewals or cancellations
A blended CSAT score hides where the real friction is.
4. Trigger CSAT Right After a Clear End Moment
Good trigger points:
- Ticket marked resolved
- Chat ended
- Onboarding step completed
- Order delivered or service completed
Avoid:
- Too Early: before the customer sees the outcome
- Too Late: memory fades, response rates drop
- Too Often: customers tune out
5. Control Frequency to Protect Response Rates
- Cap how often any one customer can be surveyed in a time window
- Prioritize “high signal” moments over surveying everything
- If response rates are dropping, you are probably oversurveying or surveying at the wrong time
6. Keep the Survey Short and Neutral
Most CSAT surveys should be two questions:
- Rating question
- “What is the main reason for your score?”
To reduce bias:
- Keep wording neutral
- Do not ask for a rating inside the support conversation
- Avoid guilt language like “we tried our best”
- Keep it one click from the customer’s current context
7. Protect Data Integrity (Especially If CSAT Is Tied to Performance)
Watch for:
- Agents nudging customers toward a top score
- Sudden score jumps with no operational changes
- Comments that do not match the rating trend
If CSAT is used for performance reviews, you need extra guardrails, or the data gets “managed.”
8. Make CSAT Accessible to Every Customer Segment
- If email does not work for your audience, use QR codes, shared devices, or short URLs
- Make the survey fast on mobile
- Remove unnecessary login steps
9. Balance Anonymity and Authentication
- Use anonymity when you need honesty. Here’s a video to learn more about anonymous surveys:
- Use light authentication when you need clean, non-duplicated data
- Decide intentionally per use case
10. Treat CSAT as One Signal, Not the Whole Story
- CSAT is best for transactional satisfaction
- Pair it with open-text feedback and complementary metrics when needed
- Do not use CSAT alone to measure loyalty or long-term health
FREE. All Features. FOREVER!
Try our Forever FREE account with all premium features!
Common CSAT Questions You Can Use Right Away
If you want reliable CSAT data, keep it simple with your customer satisfaction survey questions: one rating question + one “why” question.
CSAT Question Examples:
1. Core Rating Question
- “How satisfied were you with your experience?” (1–5 or 0–10)
2. Best Follow-Up Question
- “What is the main reason for your score?”
3. Optional Improvement Prompt
- “What is one thing we could do better?”
You can use a CSAT template for this:
Questions by Touchpoint
1. Support Ticket Resolved
- “How satisfied are you with how we handled your issue?”
- Follow-up: “What is the main reason for your score?”
Here’s a support template you can customize and use:
2. Live Chat
- “How satisfied are you with this chat experience?”
- Follow-up: “What should we improve next time?”
3. Onboarding
- “How satisfied are you with your onboarding experience so far?”
- Follow-up: “What is still unclear or blocking you?”
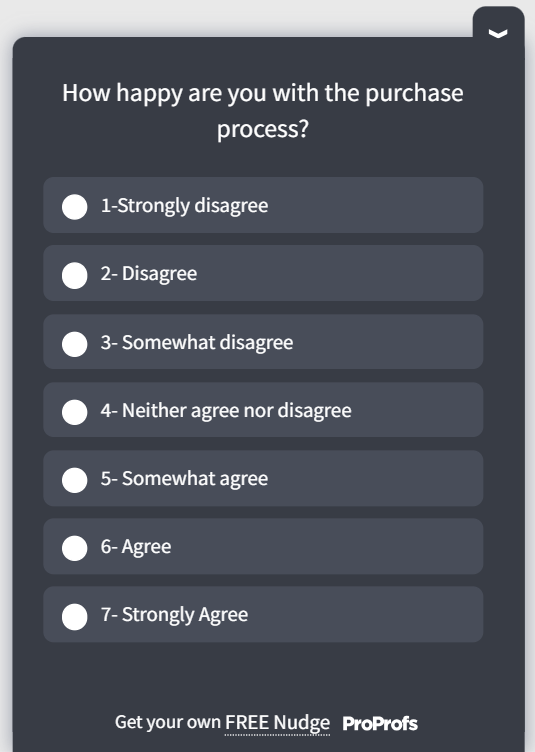
4. Checkout or Purchase
- “How satisfied are you with the purchase experience?”
- Follow-up: “What nearly stopped you from completing your purchase?”
You can use this template for post-purchase customer satisfaction surveys:
5. Delivery or Completion
- “How satisfied are you with the delivery or completion experience?”
- Follow-up: “What went wrong, if anything?”
Optional Add-On That Improves Reporting
If you want cleaner reporting without adding friction:
- “What was this feedback mainly about?”
Options: Support, Product, Billing, Delivery, Account, Other
One Rule That Prevents Biased Scores
Avoid leading or “please rate us” language. If your question sounds like it’s looking for a high score, your data will quietly stop being useful.
Common CSAT Mistakes That Skew Your Scores
Most CSAT problems are not caused by bad math. They come from small decisions that quietly distort the data over time. If your score feels confusing, volatile, or disconnected from reality, one or more of the mistakes below is usually the reason.
| Mistake | What It Looks Like | Why It Skews CSAT | What To Do Instead |
|---|---|---|---|
| Over-Surveying | Customers get pinged after every tiny action | Response rates drop, and only extremes respond | Set frequency caps per customer and survey only high-signal moments |
| Surveying at the Wrong Time | Asking before the value is delivered or days after the interaction | You measure anticipation or hazy memory, not the real experience | Trigger CSAT right after a clear “end moment” |
| Relying on the Average Only | “We are at 4.2, so we are fine” | Averages hide polarization and repeat pain points | Track percent satisfied and review score distribution, plus comments |
| No Open-Text Follow-Up | You have a score, but no clue why it moved | You cannot identify root causes, so nothing changes | Add one short question: “What is the main reason for your score?” |
| Biased or Leading Questions | “How satisfied were you with our amazing support?” | You nudge customers upward and distort the truth | Keep wording neutral and specific to the touchpoint |
| Sampling Bias | Only power users or email-active customers respond | CSAT reflects a segment, not your customer base | Diversify channels and make surveys accessible across segments |
| Score Gaming | Agents push customers toward top customer satisfaction ratings | Scores inflate, and real issues get buried | Separate coaching from surveying and monitor sudden score jumps |
| Comparing Unlike Touchpoints | One blended CSAT score across everything | You lose diagnostic clarity | Report CSAT by touchpoint and compare like with like |
| Overreacting to Small Changes | Panic over 1–2 point swings | Natural noise gets treated like a crisis | Watch trends and enforce minimum sample sizes |
| Treating CSAT as the Only Metric | CSAT becomes the health score for everything | CSAT is transactional, not predictive | Pair CSAT with qualitative feedback and complementary metrics |
| Not Closing the Loop | Customers never see action taken | Trust and response rates decline | Share improvements internally and back with customers |
| Chasing the Score, Not the Experience | Teams optimize dashboards, not outcomes | Root causes remain unresolved | Use CSAT to remove friction, not chase perfection |
CSAT vs NPS vs CES: When Each Metric Matters
One of the biggest CSAT mistakes is expecting it to answer every question. It cannot. CSAT works best when it is paired with the right supporting metrics.
Each metric measures a different part of the customer experience. Here’s a quick CSAT vs NPS vs CES rundown for you:
| Metric | What It Measures | Best Used For | What It Misses |
|---|---|---|---|
| CSAT | Satisfaction with a specific interaction | Support, onboarding, checkout, and delivery | Long-term loyalty and overall relationship |
| NPS | Likelihood to recommend | Brand loyalty and long-term sentiment | Day-to-day friction and root causes |
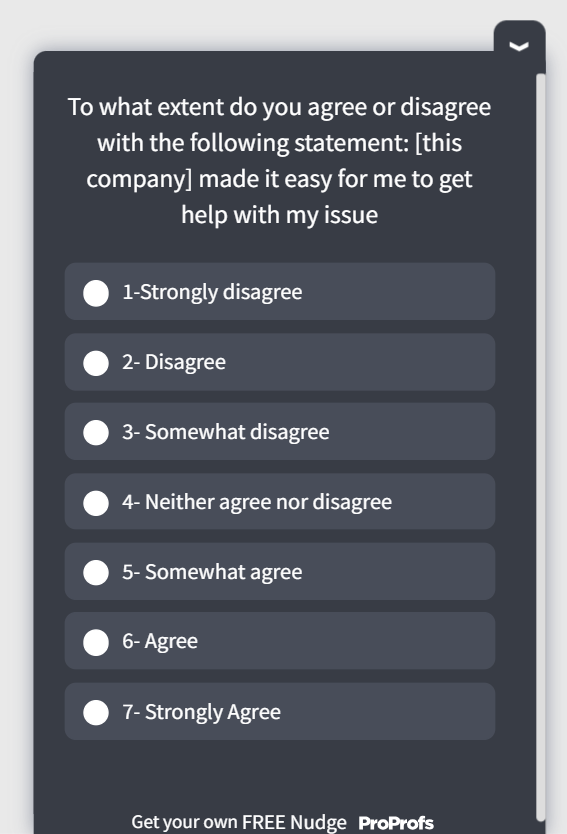
| CES | How easy it was to get something done | Identifying friction and effort | Emotional satisfaction or delight |
When to Use CSAT
Use CSAT when you want fast, transactional feedback about customer satisfaction improvement. It tells you whether a moment in the journey met expectations and where things went wrong.
Good use cases include:
- Support ticket resolution
- Live chat or call experiences
- Onboarding steps
- Post-purchase or delivery feedback
When to Use NPS
Use NPS when you want a long-term view of loyalty and brand perception. It works best as a periodic pulse, not after every interaction.
Good use cases include:
- Quarterly or annual customer surveys
- Measuring overall relationship health
- Tracking brand advocacy over time
Here’s an NPS template for you to use:
When to Use CES
Use CES when you want to reduce friction. CES is especially useful for support and self-serve workflows, where customers care more about ease than delight.
Good use cases include:
- Issue resolution
- Account changes
- Cancellations or downgrades
- Complex workflows
Here’s a quick CES microsurvey template to gauge the effort score right in the moment:
A Simple Rule of Thumb
- Use CSAT to understand how a moment felt
- Use CES to understand how hard it was
- Use NPS to understand how the relationship is trending
When these metrics work together, CSAT stops being a vanity number and starts pointing to real improvement opportunities.
Final Takeaway: CSAT Works Best When You Act on It
Customer satisfaction score is not meant to be perfect. It is meant to be useful.
When CSAT works, it gives you fast, focused feedback on moments that matter. It helps teams spot friction early, fix repeat issues, and keep customers from quietly slipping away. When it fails, it usually fails because teams treat it as a number to report, not a signal to investigate.
The difference is not the formula. It is the discipline around how you use it.
If you tie CSAT to clear touchpoints, ask neutral questions, watch trends instead of single data points, and consistently close the loop, the score starts to earn trust. It becomes a shared reference point across support, product, and retention, rather than a weekly debate.
Having a simple way to launch surveys quickly and review results in one place, like ProProfs Survey Maker, makes it much easier to maintain that discipline.
Frequently Asked Questions
How Many Responses Do You Need for Reliable CSAT Results?
A minimum of 30 responses per touchpoint provides directional insight, but 100 or more responses create stable trends. Small sample sizes cause score volatility and misleading swings. Always review response volume alongside the score before drawing conclusions or making operational changes.
What Is a Good CSAT Response Rate?
Response rates vary by channel. Email surveys often see 5–20%, in-app surveys 15–40%, and post-chat popups 25–60%. Declining response rates usually signal poor timing, oversurveying, or survey fatigue. Monitoring response health ensures your CSAT data remains representative and trustworthy.
How Often Should You Measure CSAT?
CSAT works best when triggered continuously at meaningful touchpoints, such as ticket resolution or purchase completion. Avoid surveying after every minor action. Frequency caps prevent fatigue. The goal is consistent, contextual feedback without overwhelming customers or reducing response quality.
Should CSAT Surveys Be Anonymous?
Anonymity increases honesty, especially for sensitive interactions. However, identified surveys allow follow-up and issue resolution. Many teams use light authentication to prevent duplicates while preserving comfort. Choose anonymity intentionally based on whether your priority is candid feedback or direct customer recovery.
Can CSAT Predict Customer Churn?
CSAT alone is not a churn predictor because it measures short-term satisfaction. However, consistently low scores across multiple interactions may indicate risk. When combined with behavioral data and retention metrics, CSAT becomes an early warning signal for potential churn.
How Do You Improve a Low CSAT Score?
Start by analyzing open-text comments to identify recurring friction. Segment results by touchpoint and issue type. Fix the most common blockers first, then monitor trends. Quick operational improvements often deliver measurable gains without major product or process overhauls.
Should CSAT Be Tied to Employee Performance?
Tying CSAT directly to compensation can create score gaming and coaching bias. If used in performance reviews, apply guardrails and evaluate trends rather than individual ratings. Balance CSAT with quality audits and coaching metrics to protect data integrity.
What Is the Difference Between CSAT and Customer Experience (CX)?
CSAT measures satisfaction with a specific interaction. Customer experience (CX) refers to the entire end-to-end journey across all touchpoints. CSAT is a tactical metric within a broader CX strategy. It highlights moments of friction but does not capture the full relationship.
What Tools Can You Use to Run CSAT Surveys?
Most teams use survey platforms, help desk systems, or in-app feedback tools to trigger CSAT automatically. The best tools integrate with support and CRM systems, allow segmentation, and centralize reporting. Automation ensures consistent timing and reduces manual effort.
FREE. All Features. FOREVER!
Try our Forever FREE account with all premium features!
 We'd love your feedback!
What did you like & how can we make it even better?

 Thanks for your feedback!
 Ask Your Question
Have a question? Get expert help to make your decision easier.