A customer satisfaction survey is a structured set of questions businesses use to measure how well their products, services, or experiences meet customer expectations. It collects direct feedback at key touchpoints and turns customer opinions into actionable data, helping you understand what’s working and what needs to improve.
Imagine this: You launched a new product, and the early buzz was great. But a few weeks in, sales started dipping. Customers aren’t complaining, but they’re not coming back either. You have no idea why.
Sound familiar?
That’s exactly the problem a customer satisfaction survey is built to solve. Instead of guessing what went wrong, you ask your customers directly and let their answers guide you.
In this guide, I’ll cover everything you need to know: what a customer satisfaction survey is, how to run one from start to finish, what questions to ask, how to read your results, and what to do when things get tricky. I’ve also included ready-to-use templates to help you hit the ground running.
Here’s What We’ll Cover:
Whether you’re running your first survey or trying to get more out of the ones you already send, this guide walks you through everything you need to know.
- What a customer satisfaction (CSAT) survey is and why it matters
- Why you should run one and what it helps you achieve
- How CSAT compares to NPS and CES, and which one to use
- When to send your survey for the best results
- How to measure customer satisfaction, step by step
- What a good CSAT score looks like across industries
- The types of questions to ask and when to use each
- A real CSAT survey example from start to action
- How to act on your results and handle common challenges
- Five ready-to-use survey templates you can start with today
What Is a Customer Satisfaction (CSAT) Survey?
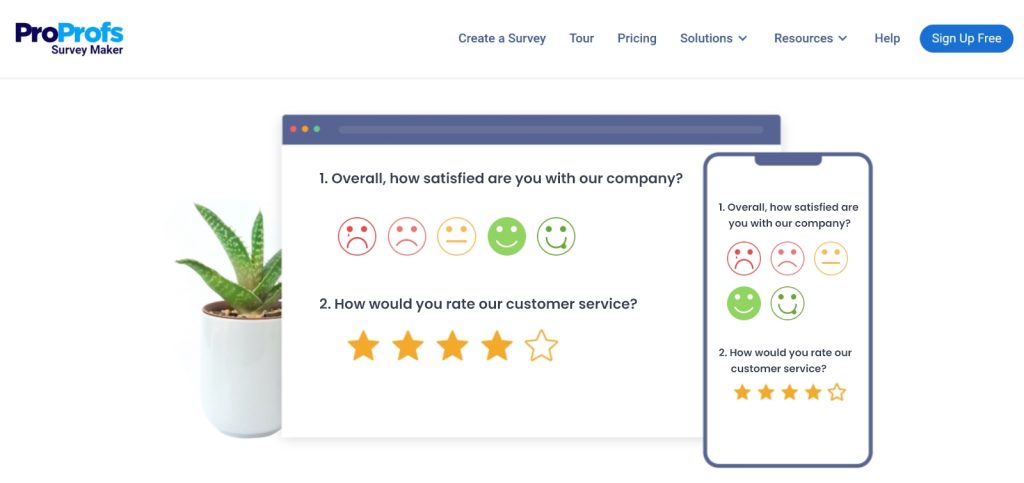
A customer satisfaction survey is a short questionnaire that asks your customers how happy they are with your product, service, or a specific experience. It’s one of the simplest ways to get honest feedback directly from the people who matter most.
Most CSAT surveys ask customers to rate their experience on a scale (usually 1 to 5), sometimes followed by an open-ended question like “What could we do better?”
The result is a CSAT score which is a clear, trackable number that tells you how you’re doing and whether things are improving over time.
Quick Fact: Studies show that 86% of consumers are willing to pay more for a better customer experience. A CSAT survey is how you find out if you’re delivering one.
Why Run a Customer Satisfaction Survey?
Running a client satisfaction survey or customer service satisfaction survey isn’t just a box-ticking exercise. Done right, it can directly impact your revenue, retention, and reputation.
Here’s what it helps you do:
- Understand What Your Customers Actually Want: Not what you think they want, what they tell you they want. That’s a big difference.
- Catch Problems Before They Go Public: An unhappy customer who fills out your survey is one who didn’t leave a bad review online. Feedback in private is far easier to handle than a crisis on social media.
- Improve Customer Retention: When customers see that you listen and act on their feedback, they stick around. It’s that simple.
- Measure Trends Over Time: A single CSAT score is a snapshot. Running surveys regularly gives you a trend line, and that’s where the real insights live.
- Drive Smarter Business Decisions: Instead of making changes based on gut feel, you make them based on what customers actually said.
CSAT vs. NPS vs. CES: Which Survey Should You Use?
This is one of the most common questions from people just starting out with customer feedback and honestly, it confused a lot of us too at first. So let’s slow down and really understand what each of these three survey types actually means, when to use them, and why they matter.
First, let’s decode the jargon.
You’ll see these three abbreviations everywhere in the business and marketing world:
- CSAT stands for Customer Satisfaction Score. It measures how happy a customer was with one specific thing like a purchase they just made, a support call they just had, or a product they just received.
- NPS stands for Net Promoter Score. It measures something bigger: overall loyalty. It asks customers whether they’d recommend your business to a friend. Think of it as a loyalty thermometer for your entire brand.
- CES stands for Customer Effort Score. This one measures friction specifically, how easy or hard it was for a customer to do something, like get their issue resolved or find an answer on your website.
| Survey Type | What It Measures | Best Used When |
|---|---|---|
| CSAT (Customer Satisfaction Score) | Satisfaction with a specific interaction or experience | After a purchase, support call, or onboarding |
| NPS (Net Promoter Score) | Overall loyalty and likelihood to recommend | Quarterly relationship check-ins |
| CES (Customer Effort Score) | How easy it was to get something done | After a support ticket or self-service task |
So which one should you use?
Here’s the simple decision guide:
- Use CSAT when you want quick feedback on a specific moment. Did a customer just finish a purchase? Did they just hang up with your support team? Send a CSAT. It’s the most common starting point for businesses new to customer feedback.
- Use NPS when you want to understand your overall standing. How loyal are your customers as a whole? Are things trending better or worse over time? NPS is your big-picture loyalty tracker. Think of it as your quarterly “state of the relationship” report.
- Use CES when friction or difficulty is your concern. If customers keep abandoning your help center, giving up mid-checkout, or escalating support tickets, the CES will tell you whether the effort required is the problem.
Pro Tip: “If you’re just starting out, begin with CSAT. It’s the easiest to set up, gives you fast feedback, and doesn’t require a lot of data to be useful. Once you’re comfortable, layer in NPS for loyalty tracking, and eventually add CES if you’re investing heavily in support or self-service tools.
When Should You Send a Customer Satisfaction Survey?
Timing is everything. A survey sent too early feels presumptuous. Too late, and the customer has already forgotten how the experience felt. The goal is to catch people at the right emotional moment, when the experience is vivid and they have something meaningful to say.
1. Right After a Purchase
The window: Within 24–48 hours of the transaction being completed.
The customer just made a decision and their feelings are strong and fresh. This is the perfect time to ask about the buying experience itself like the checkout process, pricing clarity, and how easy it was to find what they needed. Keep it to one or two questions max, and don’t ask about product quality yet, they haven’t used it.
2. After a Support Interaction
The window: Within 1–2 hours of the ticket being closed or the call ending.
Support interactions are high-stakes. A customer reached out because something went wrong, and how that interaction went will stick with them. Pair a CSAT question (“How satisfied were you with the support you received?”) with a CES question (“How easy was it to get your issue resolved?”) for a full picture. Just make sure the ticket is actually closed before you send it because surveying mid-resolution feels dismissive.
3. At Key Onboarding Milestones
The window: Right after completing a specific step like account setup, first meaningful action, or end of week one.
Onboarding is the make-or-break phase, especially for apps and subscription services. If a new customer hits friction early, most won’t complain; they’ll just quietly leave (this is called churn). A short survey at each milestone helps you catch those problems before they become cancellations. Always add one open-ended follow-up like “Was anything unclear?”, that’s where the most useful insights tend to hide.
4. Quarterly or Every 6 Months
The window: On a fixed schedule, every 3–6 months, sent to your broader customer base.
This is where NPS belongs. Unlike the others, this survey isn’t triggered by a specific event. It’s a regular relationship check-in. One NPS score in isolation tells you little, but tracking it quarter over quarter gives you a trend line that tells a story. A golden rule: no individual customer should receive a relationship survey more than once every 90 days, or they’ll start tuning them out.
5. After a Product Update or Launch
The window: Within 1–2 weeks of rolling out a significant change or new feature.
When you change something customers use regularly, reactions can be strong and swift and if you don’t ask, you won’t know which way they’ve gone. Be specific in your question: instead of “How do you feel about our product?”, try “We recently updated our checkout flow, how has your experience been since then?” Naming the change makes customers feel informed, and it makes your data far more actionable.
FREE. All Features. FOREVER!
Try our Forever FREE account with all premium features!
How to Measure Customer Satisfaction (Step-by-Step)
Running a user satisfaction survey or customer satisfaction survey analysis doesn’t have to be complicated. Here’s a simple process anyone can follow:
1. Define What You Want to Learn
This is the step most beginners skip, and it’s the reason so many surveys produce data that nobody knows what to do with. Before you write a single question, you need one clear goal.
Ask yourself: What decision will this survey help me make?
Here are some examples of clear, actionable goals:
- “I want to know if customers are happy with our checkout experience, so I can decide whether to redesign it.”
- “I want to understand why customers are cancelling in their first 30 days, so I can fix our onboarding.”
- “I want to measure how well my support team is resolving issues, so I can coach the agents who are underperforming.”
Notice how each of these has a so I can attached to it. That’s the test. If your goal doesn’t have a “so I can,” it’s not specific enough yet. A vague goal like “understand customer satisfaction” leads to a bloated survey with ten questions that produces a report nobody reads.
2. Set a Benchmark
Your first survey gives you a baseline — a starting point to measure everything else against. Without it, you have no way of knowing whether things are getting better or worse over time.
Here’s what to decide before you launch:
Which score are you tracking? Pick the formula that matches your goal. For CSAT, the formula is simple:
(Number of satisfied responses ÷ Total responses) × 100 = CSAT % Example: 80 satisfied responses out of 100 total = CSAT score of 80%
For NPS, it’s: % of Promoters minus % of Detractors.
What does “good” look like for your industry? General benchmarks to orient yourself:
| Industry | Average CSAT | Average NPS |
|---|---|---|
| E-commerce / Retail | 78–82% | 45–60 |
| SaaS / Software | 75–80% | 30–50 |
| Financial services | 72–76% | 34–45 |
| Healthcare | 77–82% | 27–40 |
| Hospitality | 80–85% | 55–70 |
Don’t obsess over hitting industry averages right away. Your most important benchmark is your own last score. Improvement over time matters more than where you start.
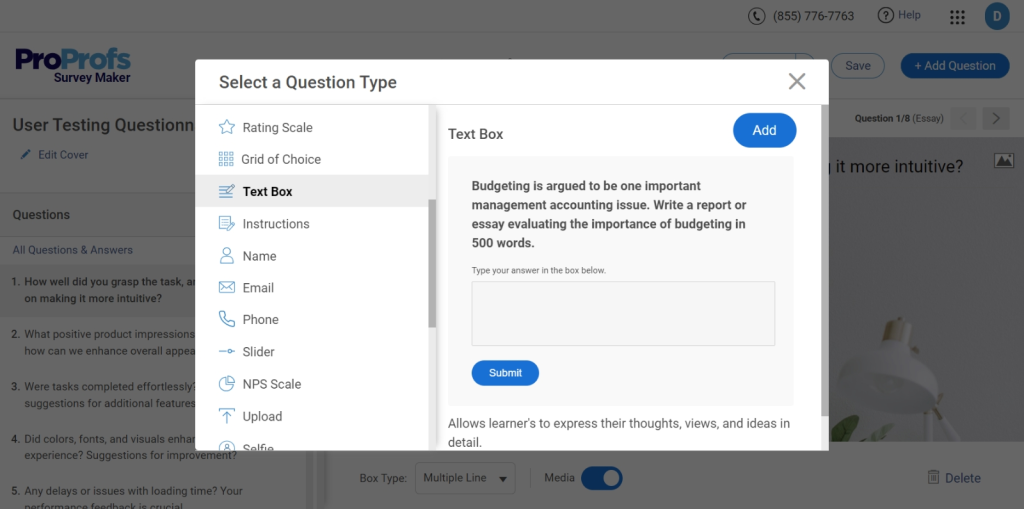
3. Create the Survey
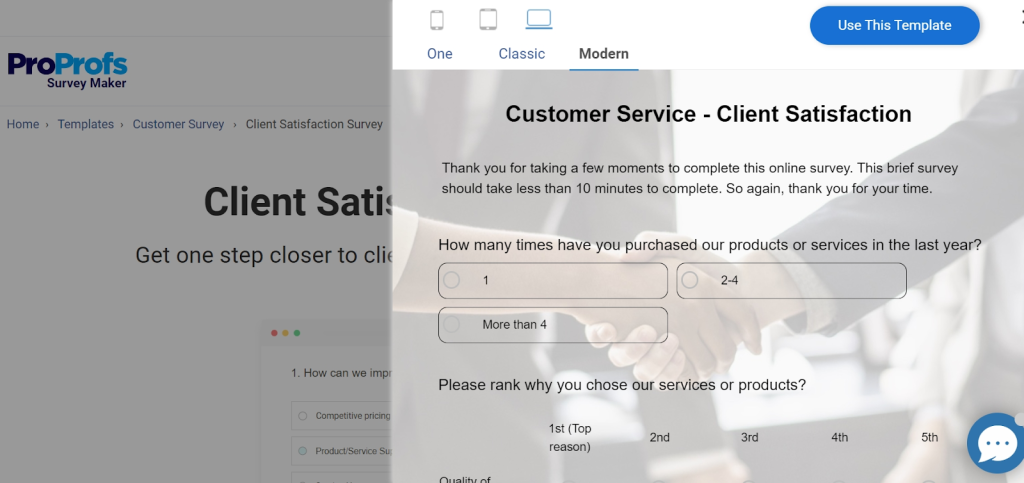
To demonstrate the build process, I’m using ProProfs Survey Maker because it keeps the setup straightforward without removing important configuration options. You can either build with AI assistance or use a structured survey flow.
Method 1: Use ProProfs AI to Build Your Survey
Here’s a quick video to learn how to create a customer satisfaction survey:
Step 1: Create the Base Survey
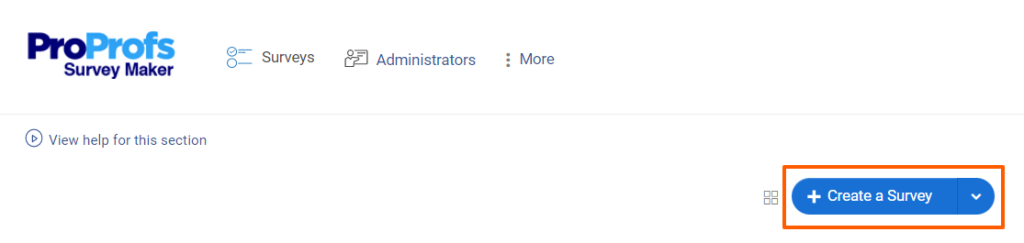
- Hover over “Create a Survey.”
- Choose “Create from Scratch” or select a customer satisfaction template.
Step 2: Generate or Improve Follow-Ups With AI
Click “Add Question” → “Generate with ProProfs AI.”
- Enter a short description (e.g., “Customer satisfaction survey for SaaS product”)
- Add brief context
- Select the question type
- Choose number of questions
- Click Generate
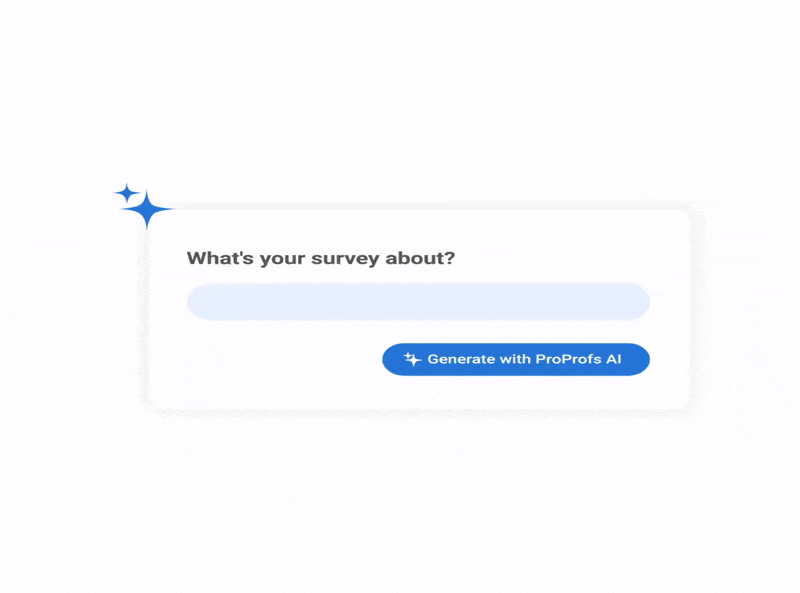
Review, add, delete, or regenerate. To refine an existing question, click “Edit With AI,” enter an instruction like “make this more conversational,” then regenerate and replace.
Step 3: Configure Settings
In Settings:
- Choose your distribution channel
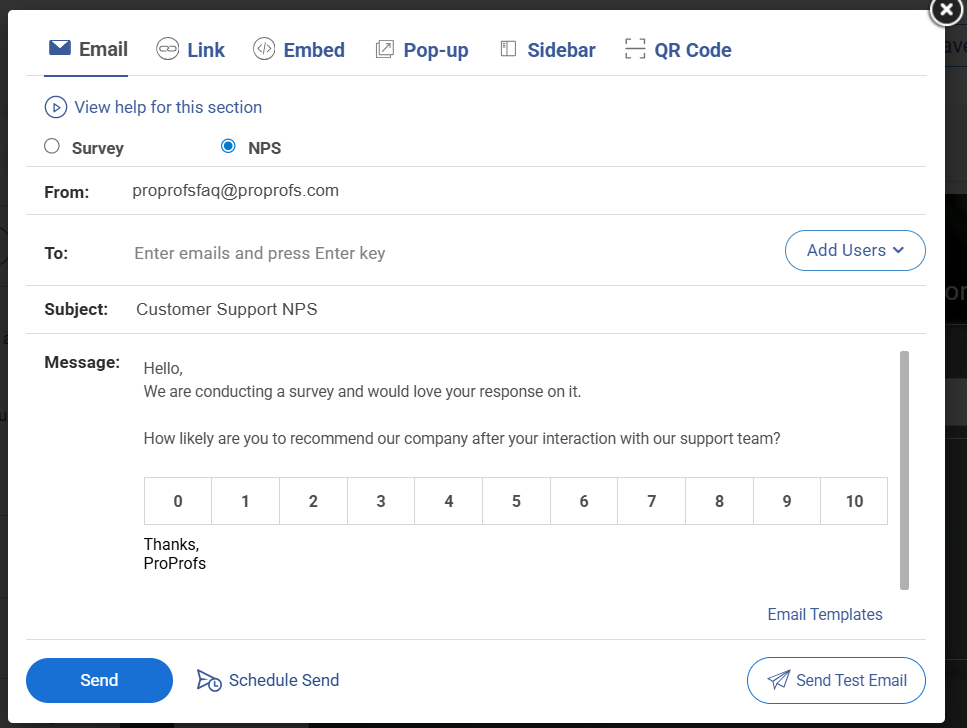
- Set start and end dates
- Limit response frequency
- Enable anonymous mode if needed
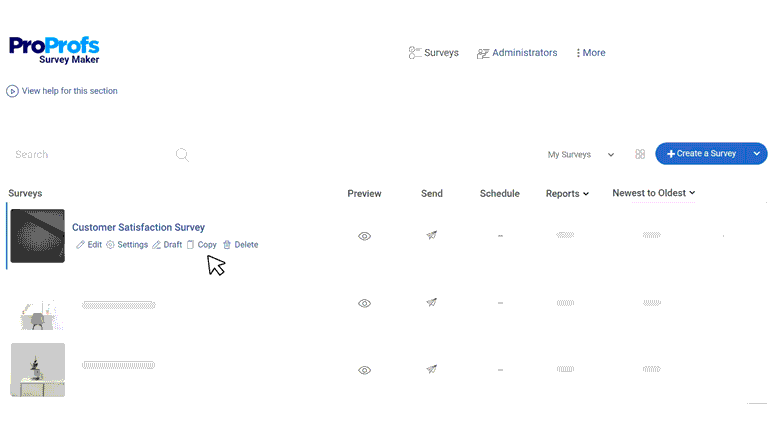
Launch and monitor responses in the dashboard.
Method 2: Build It Manually
If you prefer a more hands-on approach, here’s a walkthrough on how to create surveys the traditional way:
4. Choose How You’ll Send It
The channel you use affects who responds and how honestly they respond. Here’s a practical breakdown:
| Channel | Best for | Typical response rate | Watch out for |
|---|---|---|---|
| Post-purchase, NPS, relationship surveys | 15–25% | Easy to ignore; subject line matters a lot | |
| In-app or on-website | SaaS products, digital experiences | 25–40% | Can feel intrusive if timed poorly |
| SMS | Post-transaction, post-support | 30–45% | Keep it very short; one question max |
| QR code | In-person, events, physical retail | Varies widely | Only works if customers are motivated to scan |
A few practical tips:
- For email surveys, your subject line determines whether the survey gets opened at all. Keep it human: “Quick question about your recent order” outperforms “Customer Satisfaction Survey — Please Complete.”
- For in-app surveys, trigger them based on behavior, not time. Show the survey after a customer completes a specific action, not just because they’ve been logged in for 5 minutes.
- For SMS, the entire survey ideally fits in one message. Link to a mobile-optimized single-question page.
- Whatever channel you use, always tell customers upfront how long it takes: “This takes 2 minutes.” It dramatically increases completion rates.
5. Analyze the Data
Raw data is just numbers until you know what to do with it. Here’s how to approach analysis without getting overwhelmed.
For your rating questions (CSAT, NPS, CES):
Start with your overall score, then immediately break it down. An overall CSAT score of 78% sounds decent but what if customers who contacted support are at 55% while customers who didn’t are at 90%? The overall number hid a serious problem. Always look at your score through these lenses:
- By Touchpoint – purchase, support, onboarding, renewal. Where are scores highest? Where are they lowest?
- By Customer Segment – new vs. long-term customers, free vs. paid users, different product lines or regions.
- By Time – are scores trending up or down month over month?
For open-ended responses:
Don’t try to read every single response individually, group them by theme. Read through the first 20–30 responses and write down the themes you notice. Then go back through all responses and tag each one. Common themes might include: “slow shipping,” “confusing onboarding,” “support team was helpful,” “pricing confusion.”
Once tagged, count how often each theme appears. The most frequent themes are your priorities. A complaint mentioned by 3 customers is an anecdote. The same complaint mentioned by 60 customers is a pattern you need to fix.
6. Segment Your Findings
An overall score is a starting point, not a conclusion. Before you act on any findings, break your data down into meaningful groups because the same overall score can tell completely different stories depending on who you look at.
Useful ways to segment:
- New vs. Long-Term Customers: New customers often score lower because they’re still figuring out your product. Long-term customers scoring low is a red flag for churn risk.
- By Product or Feature: If you offer multiple products or plans, segment by each. A score of 75% overall might mask one product sitting at 55%.
- By Region or Market: Customers in different countries or time zones may have very different experiences, especially around support availability or shipping times.
- By How They Contacted You: Did customers who used live chat score higher than those who used email support? That’s an actionable insight for your support team.
The goal of segmentation isn’t to produce more charts; it’s to find the specific group that needs attention so you can take a specific action.
7. Take Action and Close the Loop
This is the step that separates businesses that build trust from those that collect data and do nothing with it. “Closing the loop” means going back to customers and showing them their feedback led to something real.
- Internally: Share the findings with every team that can act on them — not just a summary email, but a clear breakdown of what customers said, what the priority issues are, and who owns fixing each one. Assign owners and deadlines. A survey finding without an owner is just a to-do item that never gets done.
- Externally With Individual Customers: If someone left a low score or a detailed complaint, follow up with them personally. A short email saying “We saw your feedback, we looked into it, and here’s what we’ve done” can turn a frustrated customer into a loyal one. Most companies never do this which means the ones that do stand out completely.
- Externally With Your Broader Customer Base: When a common piece of feedback leads to a change, tell your customers. In your product update emails, in your social posts, in your onboarding flows — add a line like “You asked for this, so we built it.” This signals to every customer and not just the ones who responded that their voice actually matters.
What Is a Good CSAT Score? Industry Benchmarks
“Is our score good?” is the first question most teams ask after getting results. Here’s how to answer it.
General Benchmarks
| Score Range | What It Means |
|---|---|
| Above 80% | Excellent: most customers are happy |
| 70%–80% | Good: room for improvement in specific areas |
| Below 70% | Needs attention: key pain points to address |
Industry-Specific Benchmarks
| Industry | Average CSAT Score |
|---|---|
| Full-Service Restaurants | ~84% |
| Retail / E-commerce | ~78–80% |
| Banking & Finance | ~78–80% |
| B2B SaaS / Software | ~75–78% |
| Internet & Software Services | ~75% |
| Telecommunications | ~65–70% |
| Healthcare | ~70–75% |
| Education | ~64% |
Pro Tip: “Don’t just compare yourself to a general average. Compare yourself to your own industry and more importantly, to your own past scores. Improving from 68% to 74% in a quarter is a win, regardless of where the industry sits.
Types of Questions to Ask in a Customer Satisfaction Survey
The right question type depends on what you want to learn. Here are the six main types, with examples:
1. Rating Scale Questions
What it is: It is a format where customers pick a number on a scale (typically 1–5 or 1–10) to represent how positive or negative their experience was. Visual variants like stars or emoji faces work especially well on mobile.
Example:
“On a scale of 1 to 5, how satisfied were you with your recent purchase?” 1 = Very Unsatisfied → 5 = Very Satisfied
Best for: Getting a clean, trackable number fast. Because the format is consistent every time you send it, you can compare scores week over week, month over month, and spot trends easily.
Beginner tip: Stick to one scale and use it consistently. If you use 1–5 this month and 1–10 next month, your scores become incomparable. Pick a scale and commit to it.
Watch out for: Scale confusion. Always label both ends clearly. Tell respondents what 1 means and what 5 means. Never assume they’ll guess correctly.
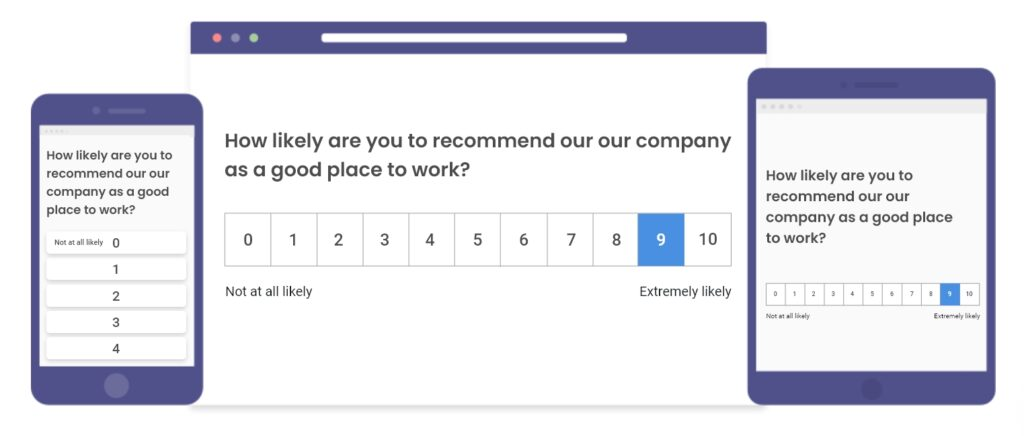
2. NPS Questions
What it is: NPS questions are type of a single question asking how likely a customer is to recommend your business to someone they know, answered on a scale of 0–10. Answers split into three groups: Promoters (9–10), Passives (7–8), and Detractors (0–6). Your NPS = % Promoters − % Detractors.
Example:
“On a scale of 0 to 10, how likely are you to recommend [Company Name] to a friend or colleague?”
Best for: Measuring overall loyalty and not just whether someone was satisfied in a single moment, but whether they trust your brand enough to put their own name behind it. It’s also the best question type for tracking long-term trends.
Always follow it up with:
“What’s the main reason for your score?”
Without this follow-up, you know that someone is a Detractor but have no idea why. The follow-up is where the actionable insight lives.
Watch out for: Using NPS after every single interaction. NPS is a relationship-level question. It should be sent periodically (quarterly or every 6 months), not after every purchase or support call. Overusing it dilutes its meaning.
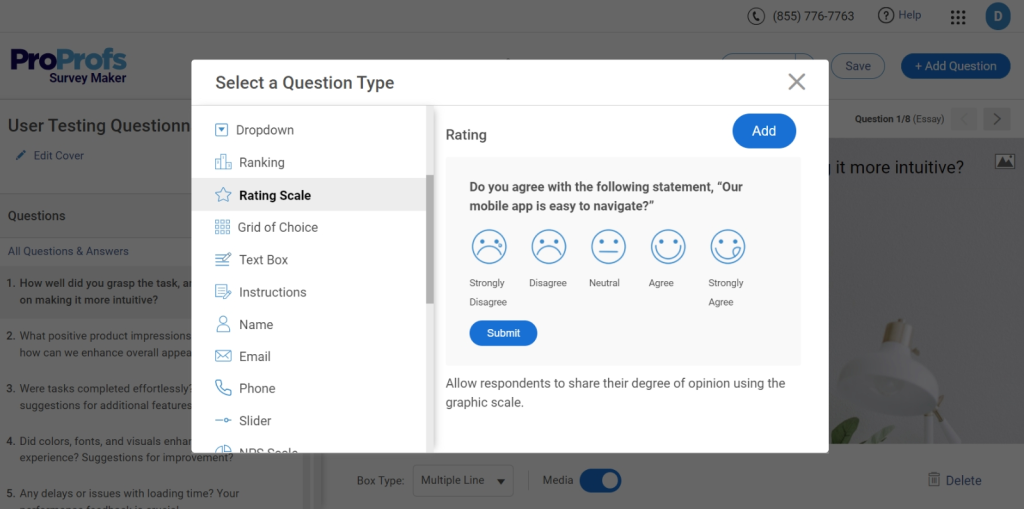
3. Likert Scale Questions
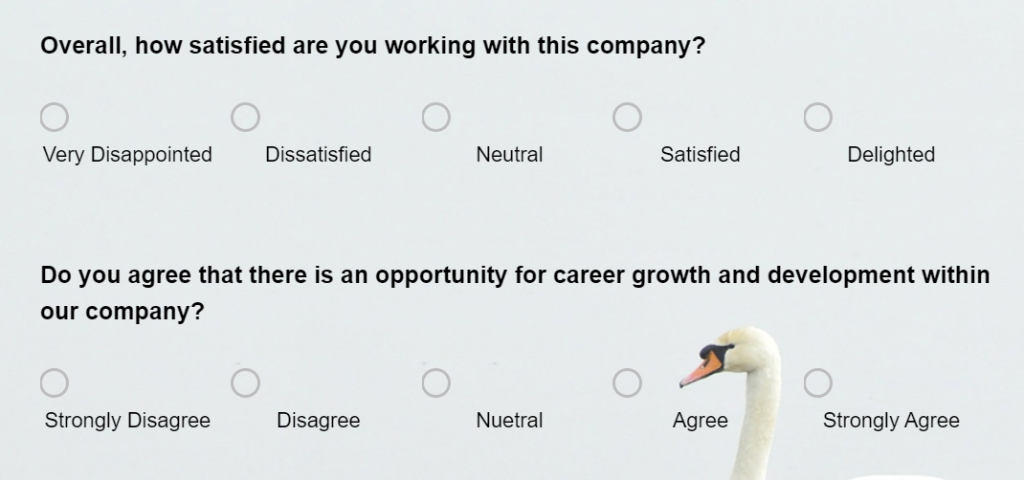
What it is: Likert Scale Questions is a format where you present a statement and respondents indicate how strongly they agree or disagree with it, usually on a 5-point scale: Strongly Agree, Agree, Neutral, Disagree, Strongly Disagree.
Example:
“The support agent resolved my issue quickly.” Strongly Agree → Strongly Disagree
Best for: Measuring attitudes and perceptions about specific parts of your product or service and not just overall satisfaction, but how customers feel about something particular. Likert scale questions are great when you want to pressure-test an assumption.
Good vs. bad Likert statements:
- Bad: “Our product is easy to use and meets your needs.” – This is two statements in one. Split it.
- Good: “I was able to find what I needed without any difficulty.” – One clear, testable statement.
Watch out for: The neutral option. Some respondents pick “Neutral” simply to avoid making a decision. If you’re getting an unusually high neutral rate, it sometimes means your statement wasn’t specific enough to prompt a real opinion.
4. Multiple Choice Questions
What it is: Multiple choice questions is a format where respondents pick one (or sometimes several) answers from a fixed list of options you define in advance. Keeps responses consistent and easy to analyse.
Example:
“What was the primary reason you contacted our support team today?”
- I had a billing question
- My order was delayed or missing
- I needed help using a product feature
- I wanted to cancel or change my subscription
- Something else
Best for: Collecting structured data that’s easy to analyze at scale. Because every respondent chooses from the same list, you can instantly see what percentage selected each option; no manual grouping required.
Beginner tip: Always include a “Something else” or “Other” option. No matter how thorough your list is, there will always be a reason you didn’t think of. Leaving it out forces customers into the wrong answer and corrupts your data.
Watch out for: Making the list too long. More than 5–6 options causes decision fatigue and leads to people selecting the first or last option rather than the most accurate one.
5. Open-Ended Questions
What it is: Open-Ended Questions is a format where you ask a question and leave a blank text box for customers to respond in their own words — no scales, no options, no restrictions on what they can say.
Example:
“What’s one thing we could do to improve your experience?”
Best for: Uncovering insights you didn’t know to look for. Every other question type on this list only tells you what you already thought to ask about. Open-ended questions are where customers tell you things that surprise you like the complaint you never anticipated, the feature they love that you were about to remove, the confusion point in your checkout that’s been silently costing you conversions.
More strong open-ended questions:
- “What almost stopped you from completing your purchase today?”
- “Is there anything about your experience that we should know about?”
- “What would make you more likely to recommend us to others?”
Watch out for: Asking too many open-ended questions in one survey. They require real effort from respondents, and most people will abandon a survey that asks them to write paragraphs multiple times. One well-placed open-ended question per survey is usually enough.
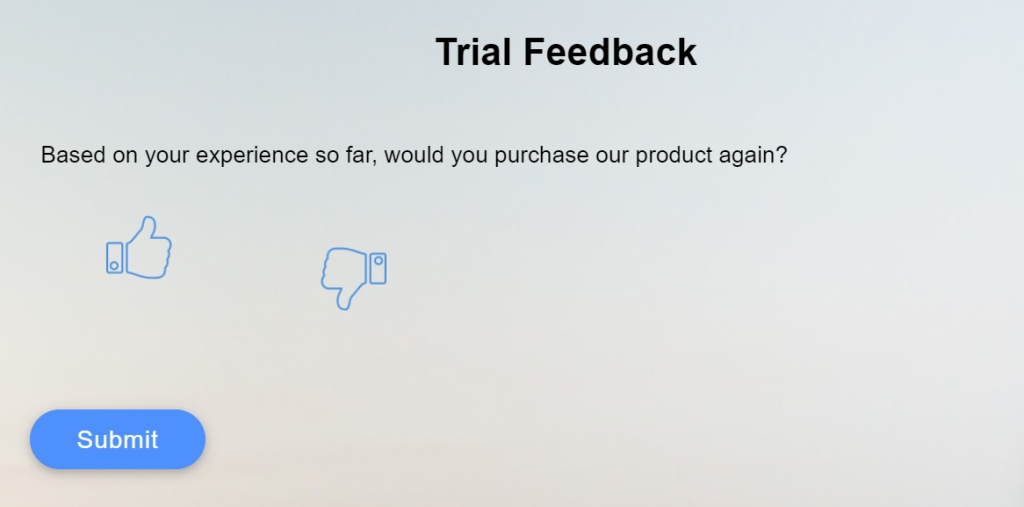
6. Binary Questions
What it is: Binary Questions is the simplest format. It is a question with exactly two possible answers. Usually Yes / No, but can also appear as Thumbs Up / Thumbs Down or Happy / Unhappy.
Example:
“Did our support team resolve your issue today?” Yes / No
Best for: High-volume, post-transaction feedback where you need a fast, frictionless signal. Binary questions have the highest completion rates of any question type because they require almost no effort. They’re especially effective in SMS surveys and post-chat pop-ups where screen space is limited.
Watch out for: Using binary questions for nuanced topics. “Were you satisfied with your experience?” as a Yes/No question loses too much information — a customer might want to say “mostly yes, but…” and a binary format forces them to round off that nuance. Save binary questions for clear-cut, factual questions like whether something was resolved, received, or completed.
Pro Tip: “Every survey should have at least one number-based question (so you can track trends) and at least one open-ended question (so you understand the why). Everything else is optional depending on your goal.
How to Act on Your Survey Results
Collecting survey data is the easy part. The hard part is what happens next. This section covers both: what to do with your results, and the real obstacles that get in the way of doing it well.
1. Analyze and Prioritize
Start with your open-ended responses and group them by categories and pain points like slow shipping, confusing onboarding, unhelpful support, and so on. Once grouped, count the frequency of each theme and cross-reference it with your rating scores.
For example, A complaint mentioned by 40% of respondents, which also correlates with your lowest CSAT scores is your number one priority. Focus on the top 2 or 3 issues first, because trying to fix everything at once usually means fixing nothing well.
2. Share Findings Across Your Whole Organization
Customer feedback doesn’t belong to one department. A complaint about confusing product instructions is relevant to your product team, repeated billing questions are a signal for marketing to clarify pricing, and high support ticket volume around the same issue is something your engineering team needs to see.
When sharing findings, translate data into plain language:
- List the top three things customers are frustrated about
- Show how frequently each issue comes up
- Explain how each one is affecting your score
Make it impossible for anyone to read it and not know what to do next.
3. Follow up Personally With Unhappy Customers
Anyone who gave you a 1 or 2 out of 5, or who left a detailed complaint, deserves a personal response rather than an automated one. Send a short, genuine message acknowledging what they said, thanking them for their time, and telling them specifically what you are doing about it.
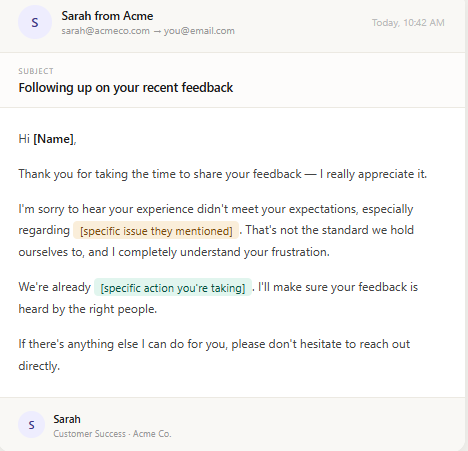
Most companies never follow up with unhappy customers at all, which means the ones that do stand out completely. Customers don’t expect perfection; they expect to feel heard.
4. Acknowledge Positive Feedback Too
Customers who take out time to say something kind deserve a response just as much as the unhappy ones. A short reply reinforces the behavior, builds goodwill, and gives you a natural opportunity to ask if they would be willing to leave a public review.
Most satisfied customers are happy to do this once they have been personally acknowledged, and that kind of organic social proof is worth far more than any paid promotion.
5. Make Changes and Tell Your Customers About Them
When a piece of feedback leads to a real change, say so publicly. In your next product update email, in your app release notes, or in a social post, say explicitly: “You told us this was frustrating, so we fixed it.”
This shows the customer who gave that feedback that their voice had a direct impact, and it signals to every other customer that feedback at your company actually leads somewhere rather than disappearing into a void.
6. Set a Recurring Cadence and Stick to It
One survey is a snapshot. A series of surveys over time is a trend line, and trend lines are where the real insight lives. Decide upfront how often you will survey customers and when you will review the results: monthly for post-interaction surveys, quarterly for NPS, and after every major product change.
Put it in the calendar, assign someone to own it, and treat it like any other business process rather than a one-off project.
Tools like Qualaroo make this easier by letting you schedule and automate surveys at each of these intervals, so you’re consistently collecting data without having to manually trigger every round. Over time, you stop asking “how are we doing right now?” and start asking “are we getting better?” — and that’s a far more useful question.
The Real Challenges (and How to Handle Them)
Running customer surveys sounds straightforward until it isn’t. Here are the five most common problems teams run into, and what to actually do about them.
FREE. All Features. FOREVER!
Try our Forever FREE account with all premium features!
1. Low Response Rates
If fewer than 15% of customers are responding, you’re not getting a reliable picture. Worse, you’re probably only hearing from people who are either thrilled or furious — not the quiet majority in between.
A few quick fixes that consistently work:
- Cut it short. 3 to 5 questions is the sweet spot.
- Go in-app, not email. In-app surveys outperform email by 10 to 20 percentage points.
- Send it fast. Survey within hours of the experience, not days later.
One more thing that helps: tell customers upfront how long it takes and what you’ll do with their answers. People are far more likely to complete a survey when they believe it will actually lead to something.
2. Survey Fatigue
Here’s the thing about survey fatigue: random answers are more dangerous than no answers, because they look like real data.
When customers are surveyed too often, they stop engaging and start clicking through just to get it over with. To avoid this:
- Make sure no single customer gets more than one survey every 60 to 90 days
- Rotate between CSAT, NPS, and CES so the format feels fresh
- Before hitting send, ask yourself: has this customer had enough new experience to give meaningful feedback right now?
If the answer is no, wait.
3. Conflicting Feedback
You run a survey. 40% of customers love a feature. 35% call it their biggest frustration. What do you do?
Don’t average it out; that instinct is almost always wrong. Conflicting feedback usually means you have two distinct customer segments with genuinely different needs. Before making any decision, dig into who is on each side:
- Are the frustrated customers newer users who haven’t learned the feature yet?
- Are they on a different plan?
- Are they using the product for a completely different purpose?
Once you know who is saying what and why, the right call usually becomes obvious.
4. Internal Resistance to Acting on Feedback
This one is frustrating but common. Teams get defensive. Feedback feels too vague. Leadership deprioritizes it when other fires are burning.
The fix? Stop framing feedback as opinions and start framing it as business data.
Instead of saying “customers are frustrated with onboarding”, say:
“Customers who score onboarding below 3 out of 5 are churning at three times the rate of those who score it 4 or above.”
When feedback is connected to churn, revenue, and retention, it becomes very hard for anyone to ignore.
FREE. All Features. FOREVER!
Try our Forever FREE account with all premium features!
5. Misreading the Data
A drop in your CSAT score doesn’t automatically mean your service got worse. Before drawing conclusions, ask:
- Did you survey a different customer segment this time?
- Did you change the timing or rephrase a question?
- Was there a sale or launch that brought in a different type of customer than usual?
The signal you can actually trust is a consistent score drop across multiple survey cycles and multiple segments with no obvious external variable to explain it. That’s when you know something real has changed and it’s time to dig in.
5 Ready-to-Use Customer Satisfaction Survey Templates
To help you get started without building from scratch, here are five templates you can use directly in ProProfs Survey Maker:
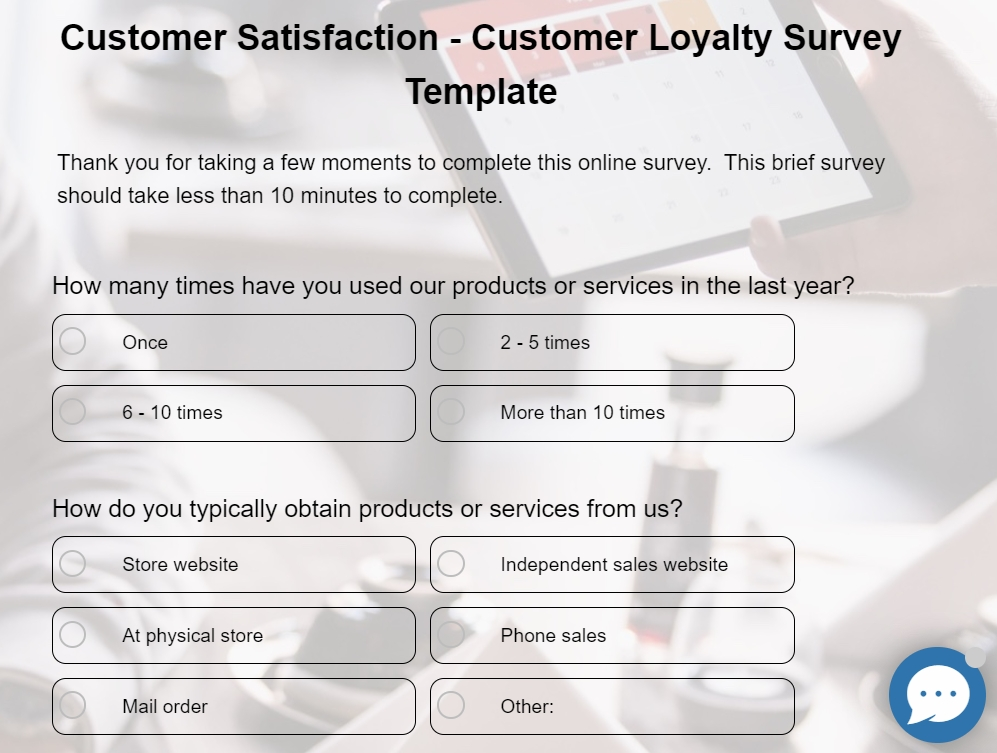
1. Customer Loyalty Survey Template
Customer Loyalty Survey Template is best for measuring how likely your customers are to stay, recommend, and advocate for your brand. Contains 10 questions covering product experience, purchase frequency, and reasons for dissatisfaction.
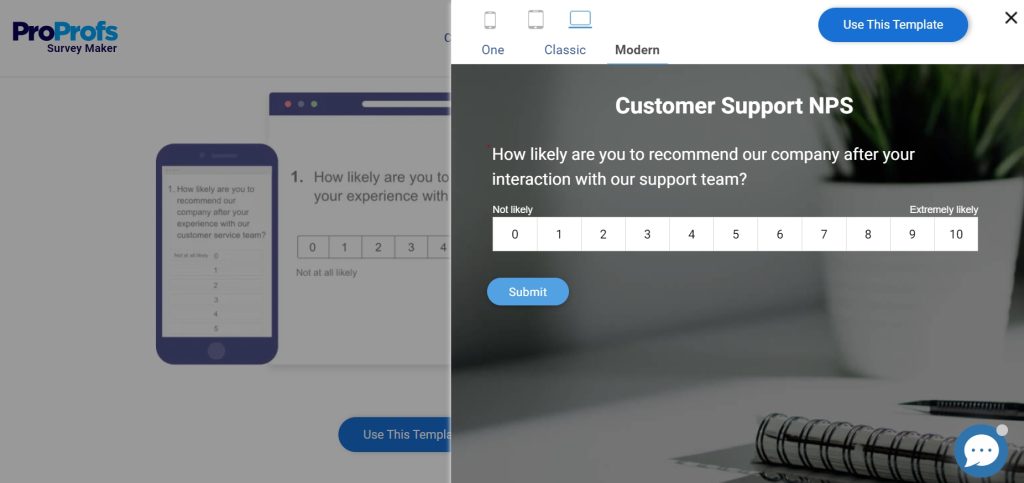
2. Customer Service NPS Template
A single NPS question asking customers to rate their service interaction on a scale of 0–10. Use the results to identify at-risk customers and your strongest advocates.
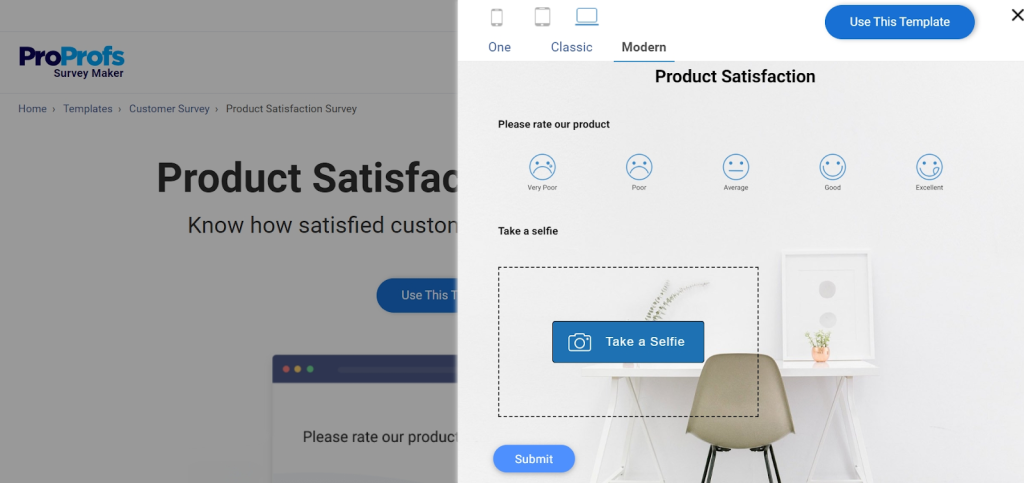
3. Product Satisfaction Survey
Collects ratings on specific product attributes like quality, value for money, durability, and more. Customizable based on your product type.
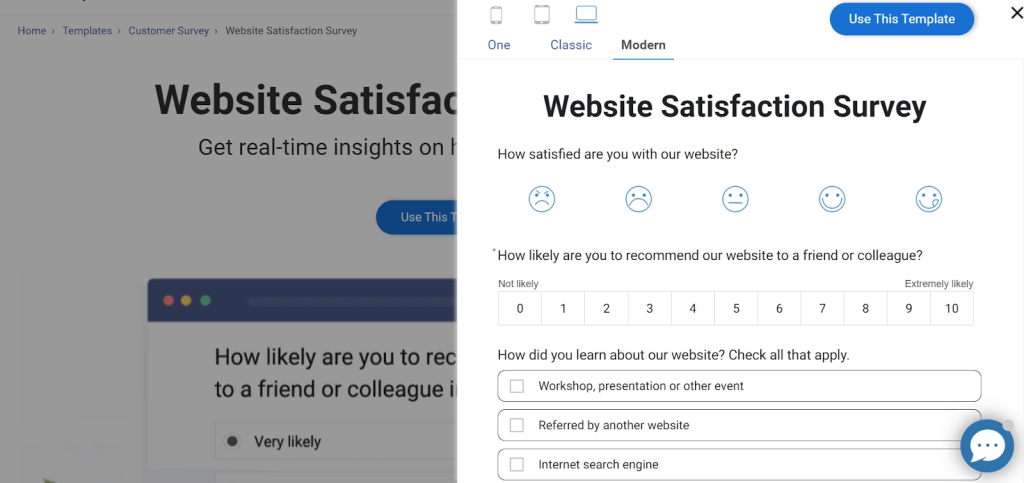
4. Website Satisfaction Template
Covers layout, navigation, content quality, and ease of use. Perfect for identifying friction points in your digital experience.
5. Client Satisfaction Survey Template
Designed for long-term clients. Measures overall perception of your products and services, likelihood of advocacy, and how you stack up against competitors.
Start Listening to the Customers Who Are Already Talking to You
Your customers have opinions about your business. Some love what you do. Some are quietly frustrated. Most will never say anything unless you ask. A customer satisfaction survey is simply how you ask and in a way that’s easy for them to answer and useful for you to act on.
The insights you get won’t always be comfortable. But they’ll almost always be valuable. And the businesses that improve fastest are usually the ones that stay curious about what their customers are experiencing, not just what the numbers say.
Once you’re ready to put this into practice, you’ll need a tool that makes building and sending surveys straightforward without a steep learning curve. ProProfs Survey Maker is one option worth exploring, especially if you’re just getting started and want something simple that doesn’t get in your way.
Frequently Asked Questions
What Is an Example of a CSAT Question?
A typical CSAT question looks like this: "On a scale of 1 to 5, with 1 being very dissatisfied and 5 being very satisfied, how satisfied are you with your recent experience with our customer support team?" Based on the responses, you calculate the percentage of customers who rated you a 4 or 5.
What Are the Most Common CSAT Questions?
Common questions include: "How satisfied were you with your recent purchase?", "Please rate your satisfaction with our service on a scale of 1 to 5", "How would you rate your overall experience today?", and "Is there anything we could have done to improve your experience?" (open-ended follow-up).
What Is a Good Response Rate for a Customer Satisfaction Survey?
A response rate of 20–30% is considered average. Above 40% is very good. Below 15% is a signal to revisit your survey timing, length, or distribution channel. In-app surveys typically outperform email surveys in response rate.
How Often Should I Send a Customer Satisfaction Survey?
It depends on the type. Post-interaction CSAT surveys should go out within 24 hours of the experience. Relationship surveys (like NPS) are typically sent quarterly or every 6 months. Avoid surveying the same customer more than once every 2 months to prevent survey fatigue.
What's the Difference Between CSAT and NPS?
CSAT measures satisfaction with a specific moment or transaction and it's transactional and short-term. NPS measures overall loyalty and how likely someone is to recommend you and it's relational and longer-term. Both are valuable, and many businesses use them together.
FREE. All Features. FOREVER!
Try our Forever FREE account with all premium features!
 We'd love your feedback!
What did you like & how can we make it even better?

 Thanks for your feedback!
 Ask Your Question
Have a question? Get expert help to make your decision easier.